

- 寫作Write an essay based on the following graphs. In your essay, you should 1)interpret the graphs, and 2)give your comments. You should write about 150 words. Write your essay on the ANSWER SHEET.
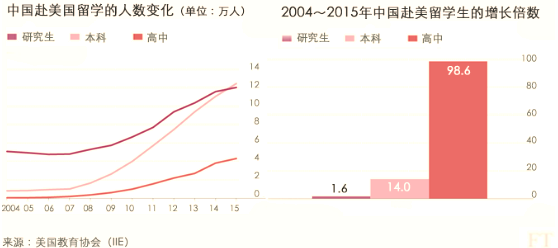 備注:美國教育協(xié)會 IIE-institute of international education
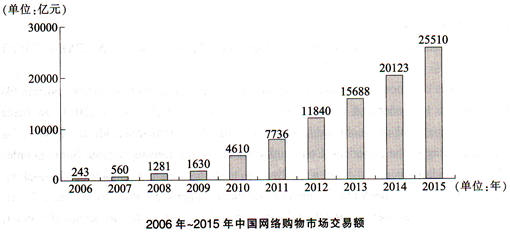

掃碼下載億題庫
精準(zhǔn)題庫快速提分
 參考答案
參考答案參考范文:
From the diagram, we can see the number of Chinese applying for overseas study keeps rising from 2004 to 2015, reaching about 300,000 according to IIE (Institute of International Education). And among those overseas students, young Chinese attending American high schools have sharply increased by almost 100 times for the past 11 years.
What accounts for the increase? In my opinion, at least three factors contribute to the change. To begin with, it is closely related to the rising wealth of the Chinese. With their living standards steadily going up, they have adequate extra money to afford overseas education. More importantly, the change has a lot to do with people’s attitudes towards overseas education. More and more parents believe that they should manage to send their children earlier to the U.S. A poll in August showed that 21 percent of Chinese people now believe that the best time for someone to study abroad is during their high school years, while early this century most Chinese believed that overseas studies should be reserved for postgraduates. Finally, the change is promoted by the fact that students who spend their high school years in the U.S have a better chance to be accepted by U.S. universities. "It's easier for students to enter American universities, if they attend high schools there," said Eliza Chou, an education consul in Shanghai.
As far as I am concerned, it’s a good thing since it brings benefits not only to themselves but to the development of China. Being the most promising economy in the foreseeable future, China is definitely among the list of best countries to work in for quite a long time. (180 words)
 您可能感興趣的試題
- 1 【寫作】 Write an essay based on the following chart. In your writing, you should 1) interpret the chart, 2) explain the phenomenon, and 3) give your comments. You should write about 150 words on the ANSWER SHEET 2.
- 2 【寫作】Write an essay based on the following table. In your writing, you should 1) Describe the table, and 2) Give your comments You should write at least 150 words. Write your essay on the ANSWER SHEET.
- 3 【寫作】Write an essay based on the following chart in your writing, you should 1) interpret the chart, and 2) give your comments You should write about 150 words on the ANSWER SHEET.
- 4 【寫作】Write an essay based on the following chart. In your writing, you should 1) interpret the chart, and 2) give your comments. You should write about 150 words on the ANSWER SHEET.
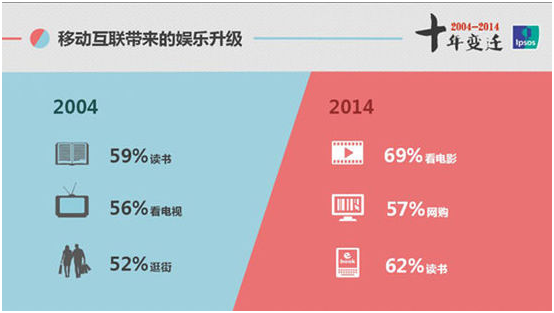
- 5 【寫作】Write an essay based on the following graph explaining the upgrading of mass entertainment transformation brought about by the increasing mobile internet access. In your essay, you should 1) interpret the graph, and 2) give your comments. You should write about 150 words. Write your essay on the ANSWER SHEET.
- 6 【寫作】Write an essay based on the following chart. In your writing, you should 1)interpret the chart, and 2)give your comments. You should write about 150words on the ANSWER SHEET.

- 7 【寫作】Write an essay based on the following chart.In your writing, you should 1)interpret the chart,and 2)Give your comments. You should write about 150 words on the ANSWER SHEET.

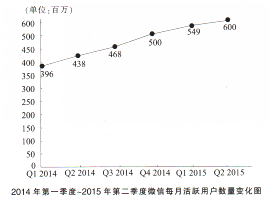
- 8 【寫作】Write an essay based on the following chart. In your essay, you should 1) interpret the chart, and 2) give your comments. You should write at least 150 words. Write your essay on the ANSWER SHEET. 2014年第一季度~2015年第二季度微信每月活躍用戶數(shù)量變化圖
- 9 【寫作】 Write an essay based on the following charts to 1) interpret the charts, 2) explain the phenomenon, and 3) give your comments. You should write about 150 words on the ANSWER SHEET.

- 10 【寫作】 Write an essay based on the following graphs. In your essay, you should 1) interpret the graphs, and 2) give your comments. You should write about 150 words. Write your essay on the ANSWER SHEET.

- 一個長方體,棱長都是整數(shù)厘米,所有棱長之和是88厘米,問這個長方體的最大表面積是()平方厘米。
- 由工業(yè)垃圾掩埋帶來的污染問題在中等發(fā)達(dá)國家中最為突出,而在發(fā)達(dá)國家與不發(fā)達(dá)國家中反而不突出。不發(fā)達(dá)國家是因為沒有多少工業(yè)垃圾可以處理。發(fā)達(dá)國家或者是因為有效地減少了工業(yè)垃圾,或者是因為有效地處理了工業(yè)垃圾。H國是中等發(fā)達(dá)國家,因此,它目前面臨的由工業(yè)垃圾掩埋帶來的污染在五年后會有實質(zhì)性的改變。 以下哪項最可能是上述論證所假設(shè)的()。
- 不等式的解集為空。() (1)a<0 (2)a>0
- 設(shè)的整數(shù)部分為a,小數(shù)部分為b,則()。
- 盒中球的最大個數(shù)是1的概率。() (1)將3個相同的球隨機(jī)放入3個不同的盒子中 (2)將3個不相同的球隨機(jī)放入3個不同的盒子中
- 根據(jù)下述材料,寫一篇700字左右的論說文,題目自擬。 美國南北戰(zhàn)爭初期,占有絕對優(yōu)勢的北方軍在戰(zhàn)爭中卻連連失利,即使林肯多次換將,也仍不見效。 一天,林肯聽到有人說:“現(xiàn)在是北方一群沒有缺點的將軍被南方一群有缺點的將軍打得一敗涂地。”尖銳的嘲諷令他很惱火。但冷靜下來后,他不得不承認(rèn)正是自己用人失策才導(dǎo)致北方軍失敗。南方軍用人只考慮此人是否對作戰(zhàn)取勝有利,而林肯卻更愿意選擇那些“無缺點”的將領(lǐng)。 于是,林肯果斷任用“傲氣十足”、“好酒貪杯”的格蘭特為作戰(zhàn)總司令。任命一公布就立刻引來一片反對之聲,但是林肯頂住壓力,力保格蘭特。果然,格蘭特僅用了一年時間,就打敗了南方軍。
- (1)
- A conclusion can be drawn from the discussion ofmarriage in the last paragraph that men and women in the culture of poverty().
- (2)
億題庫—讓考試變得更簡單
已有600萬用戶下載
0VwAW