
CFA考試相關(guān)視頻
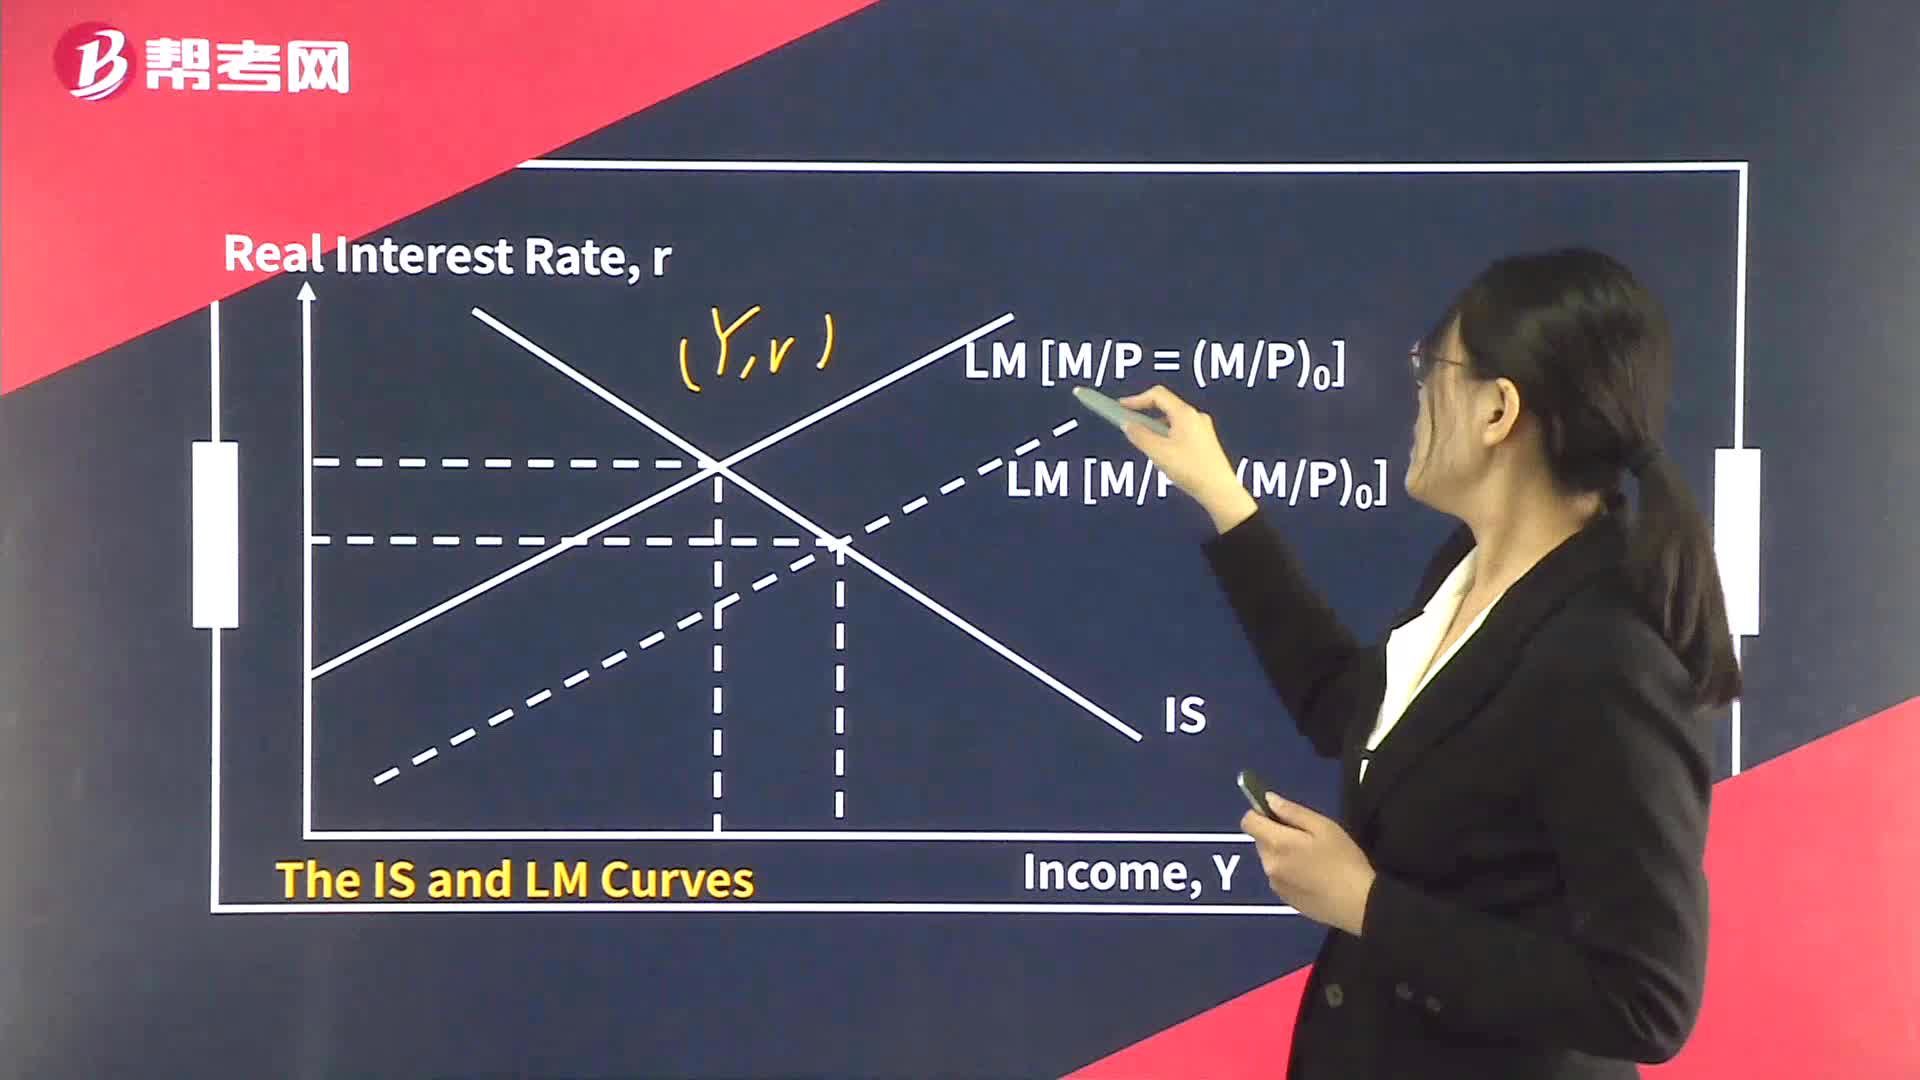
The IS Curve
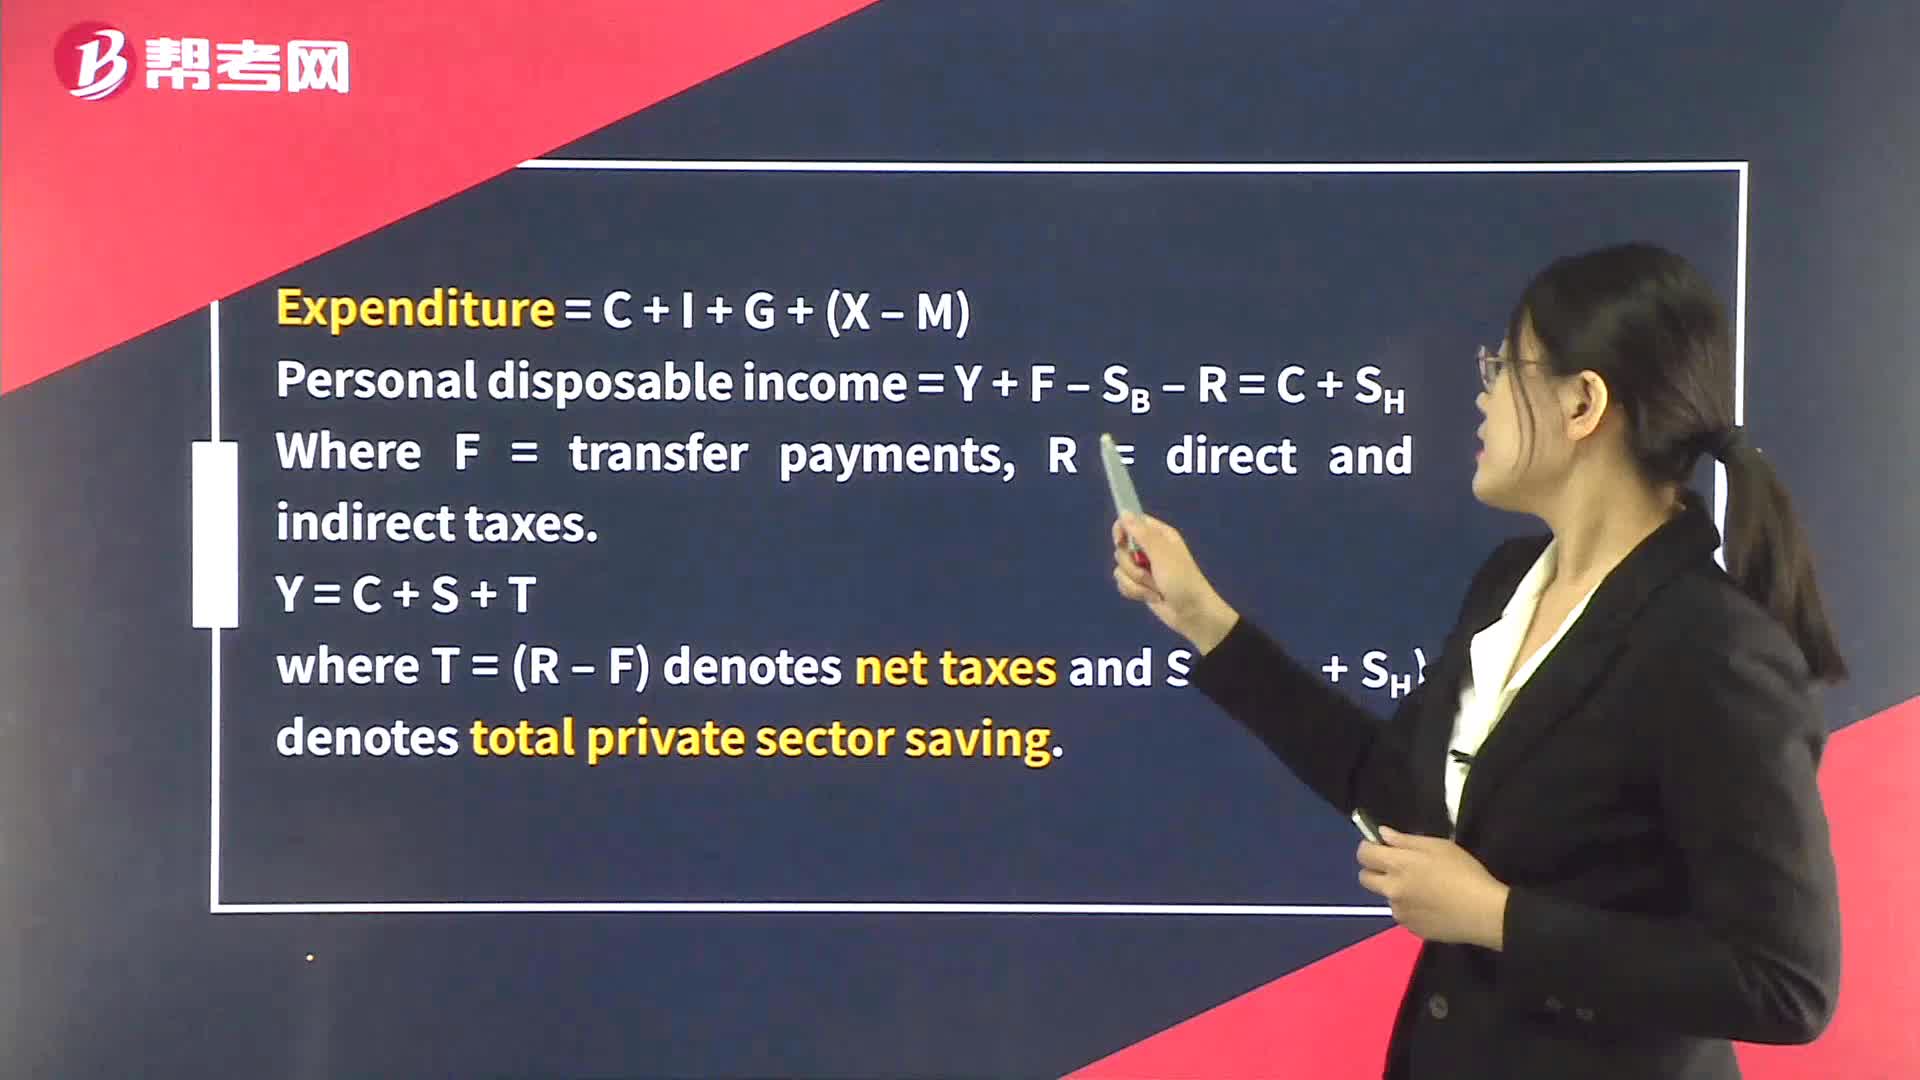
The Normal Distribution
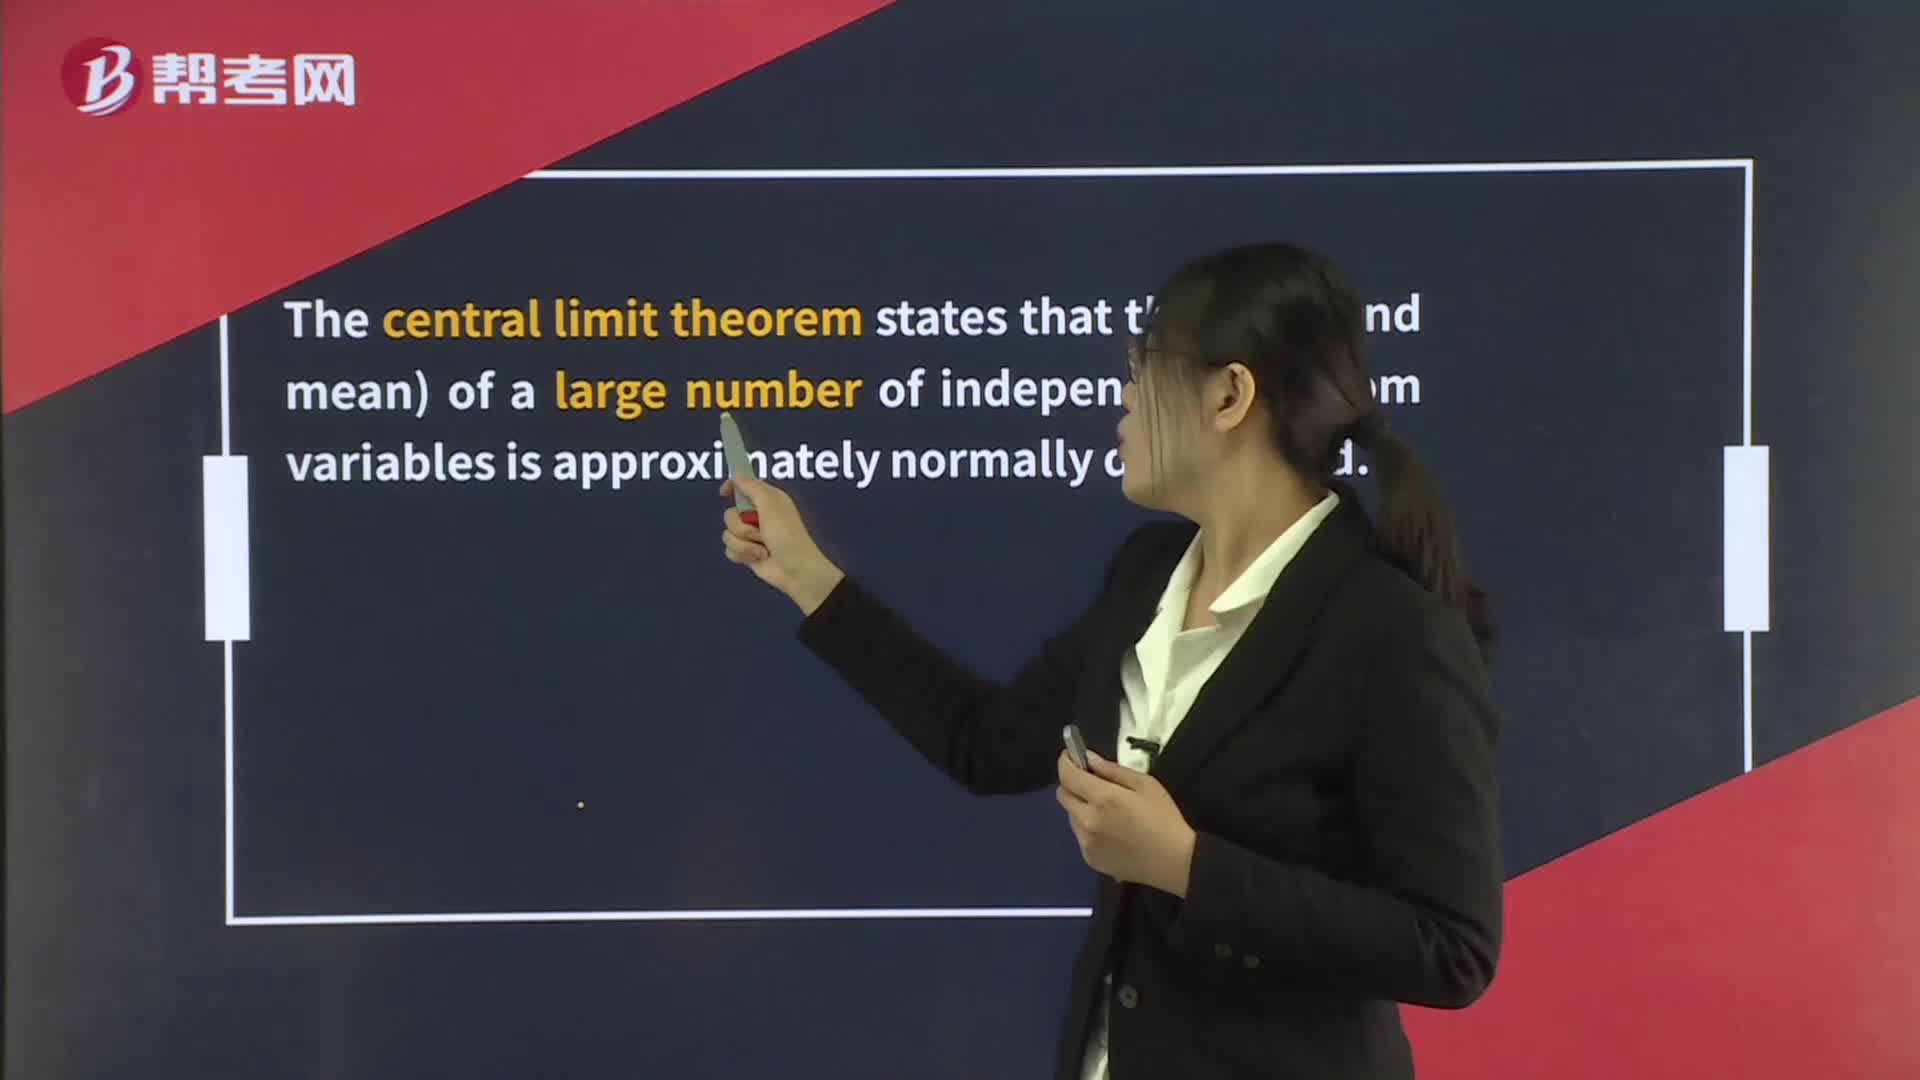
The Lognormal Distribution
The Aggregate Demand Curve
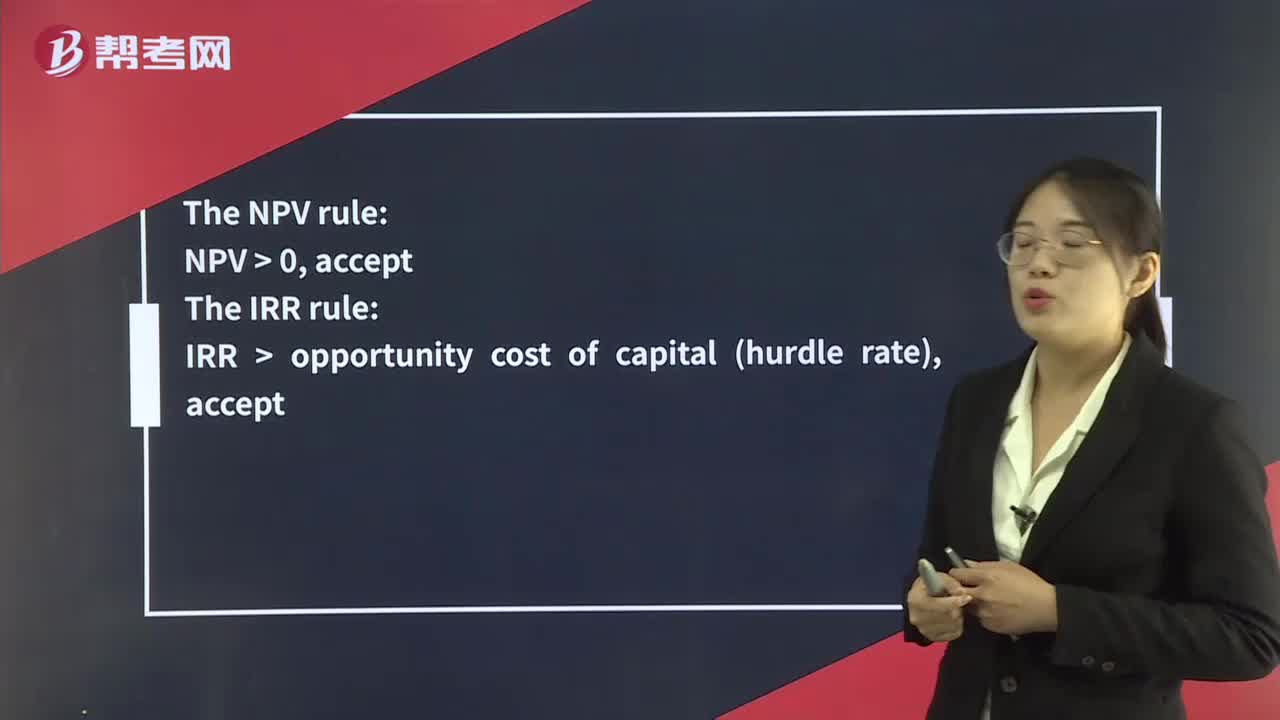
The NPV Rule & The IRR Rule
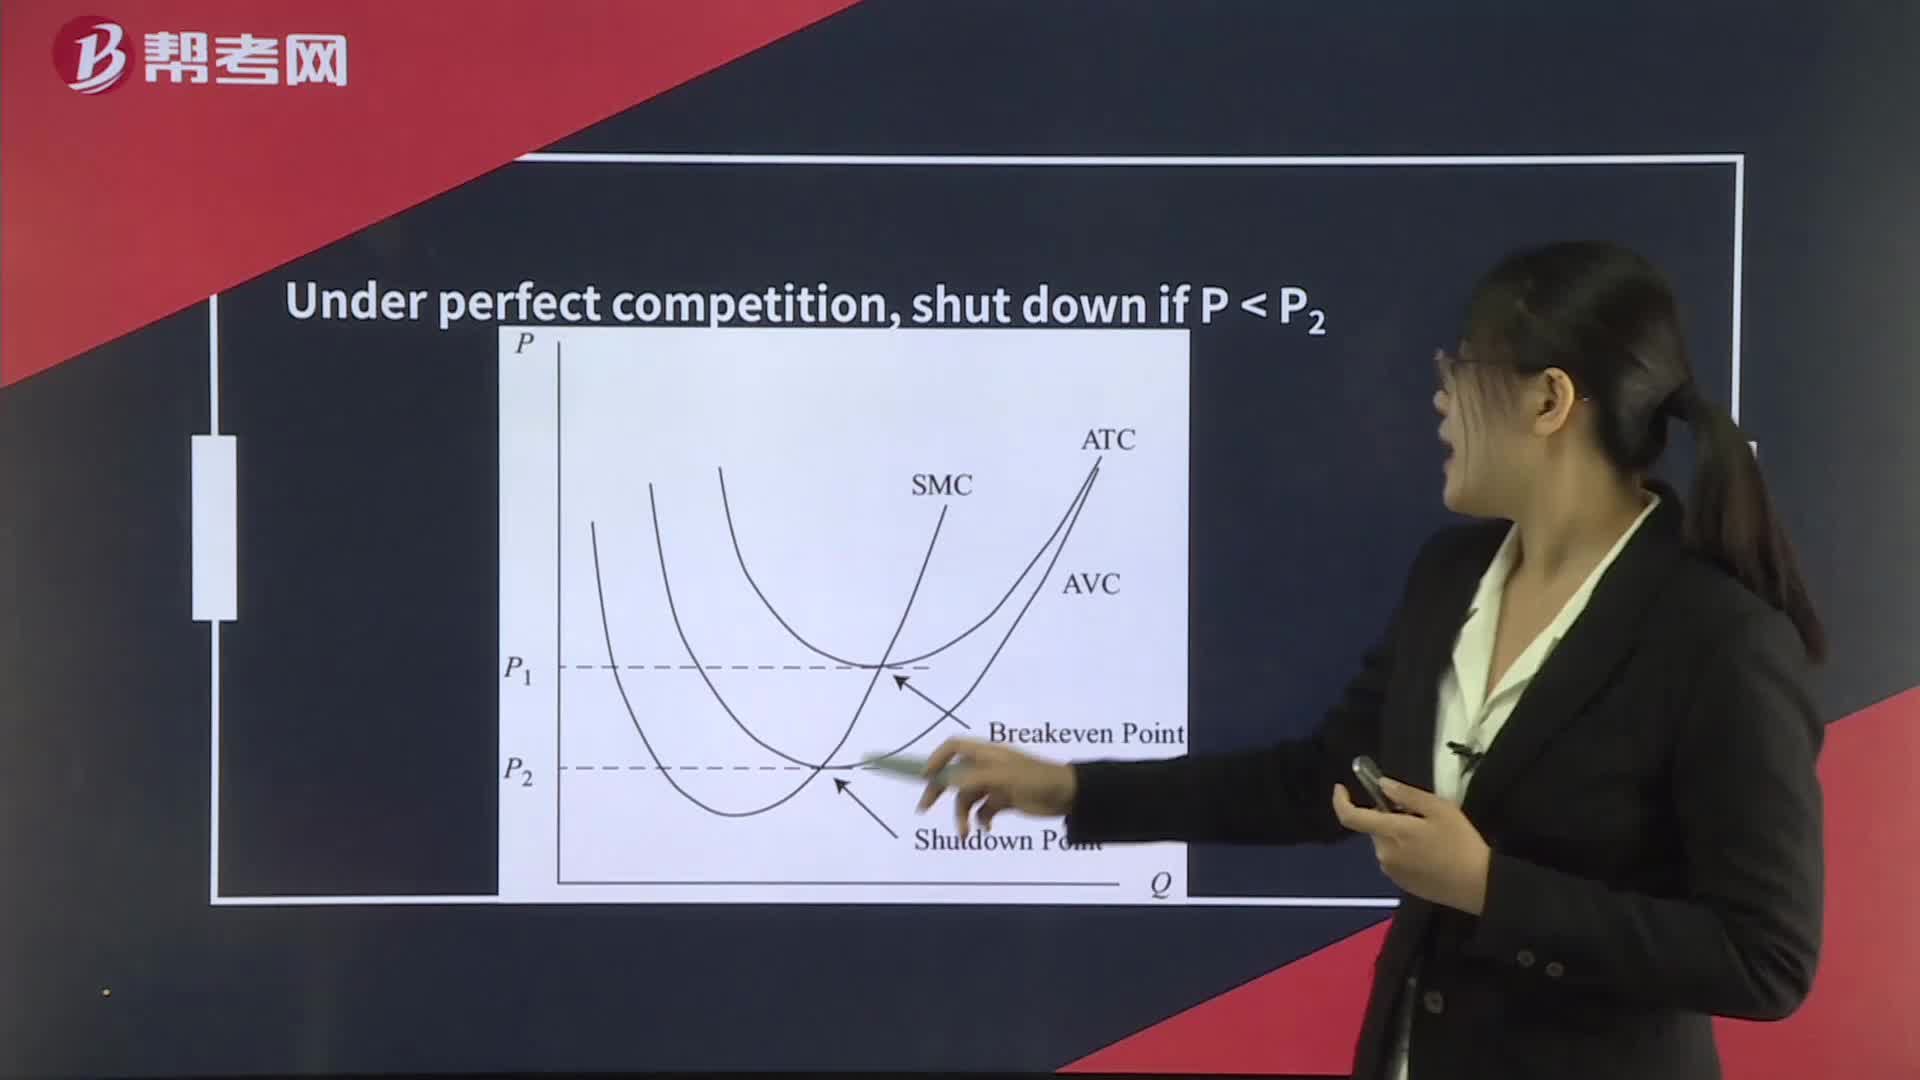
The Shutdown Decision
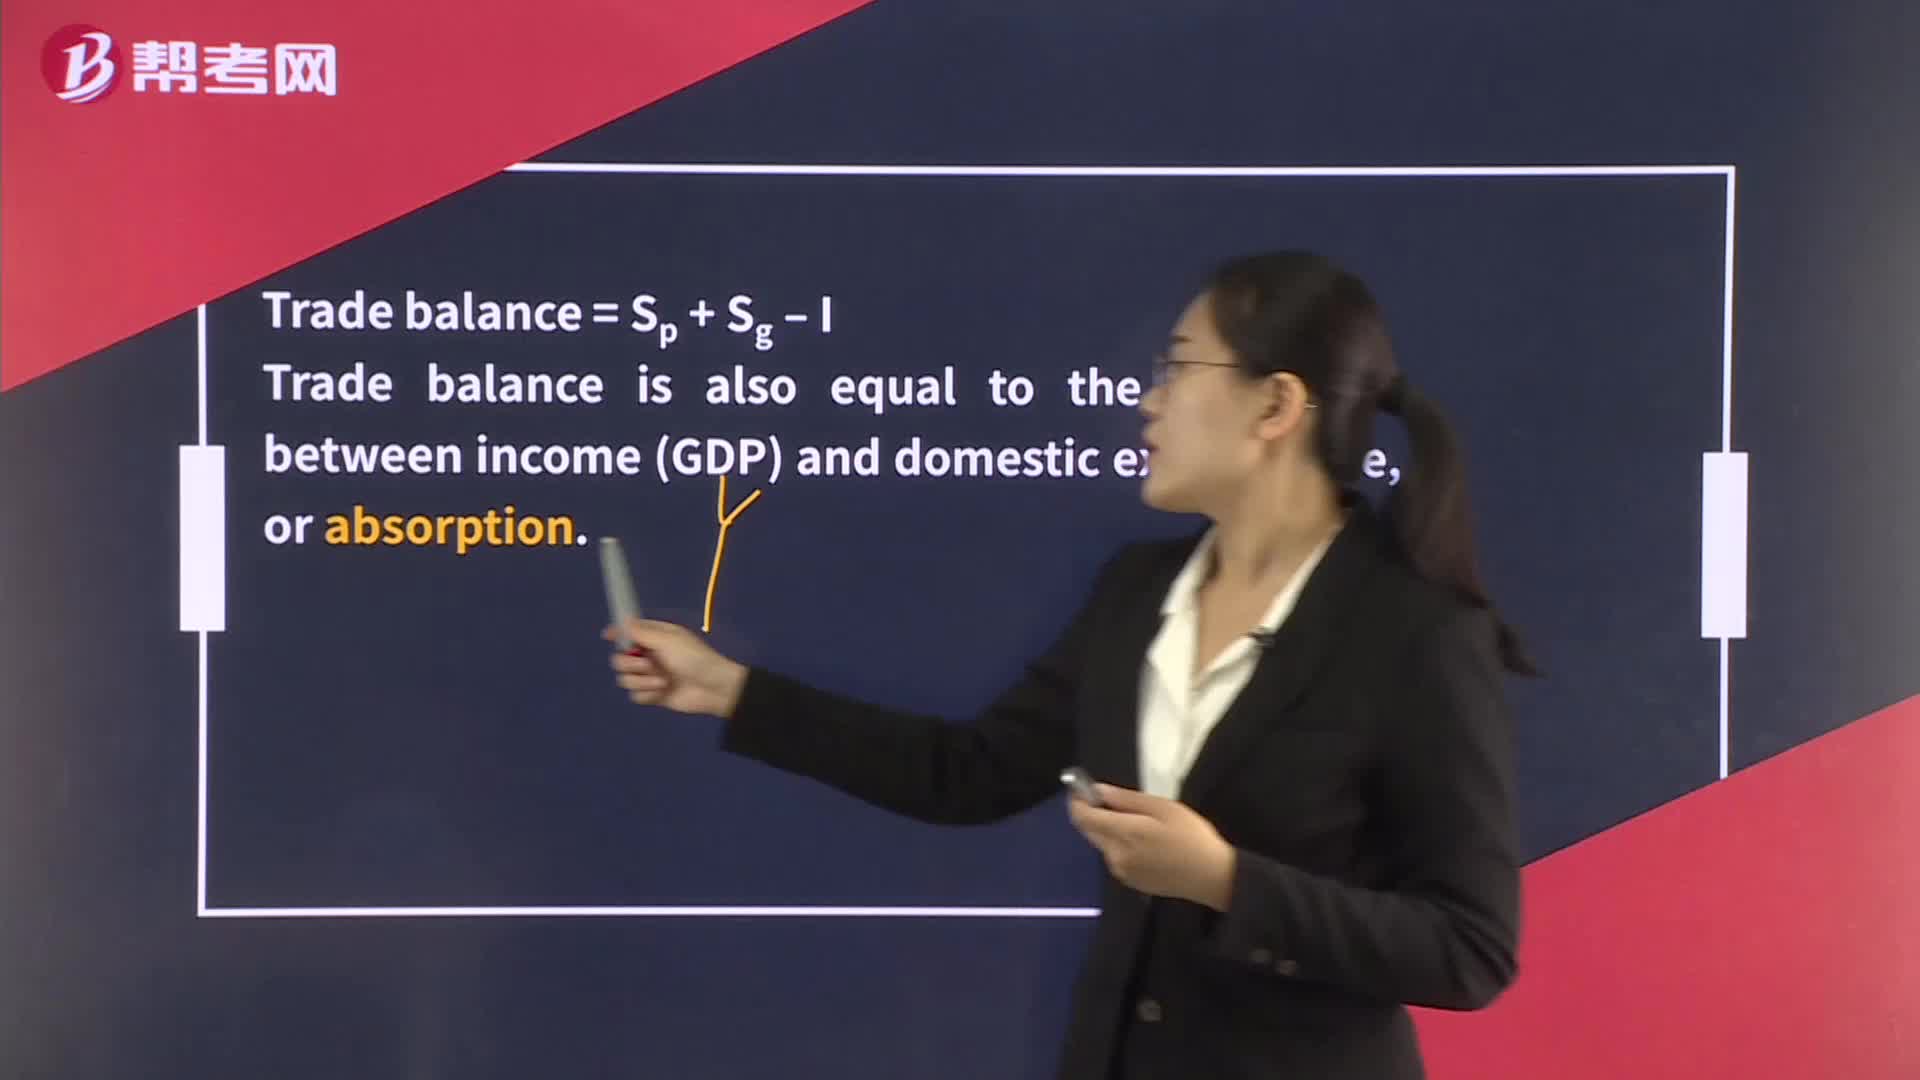
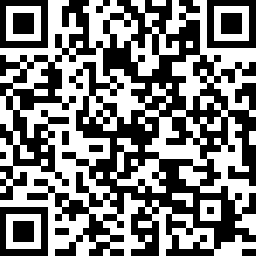
The AbsorptionApproach
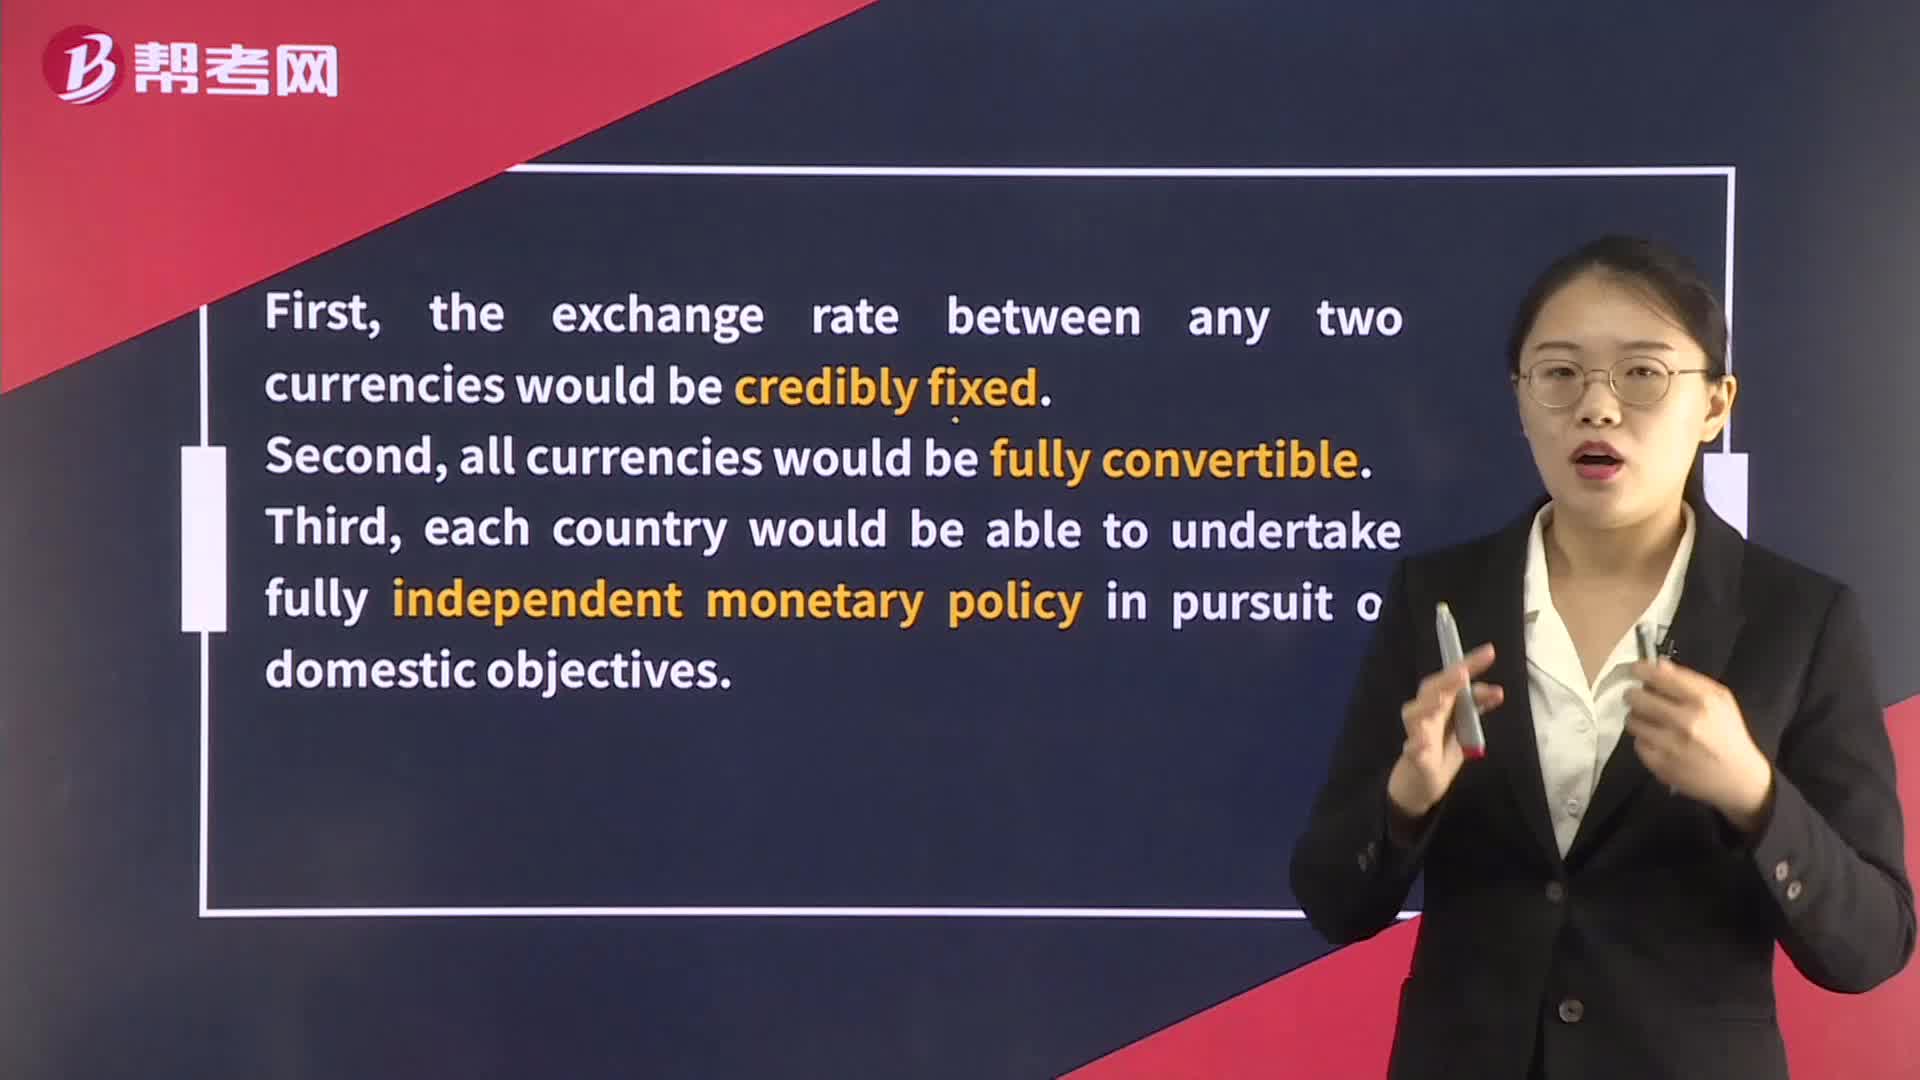
The Ideal Currency Regime
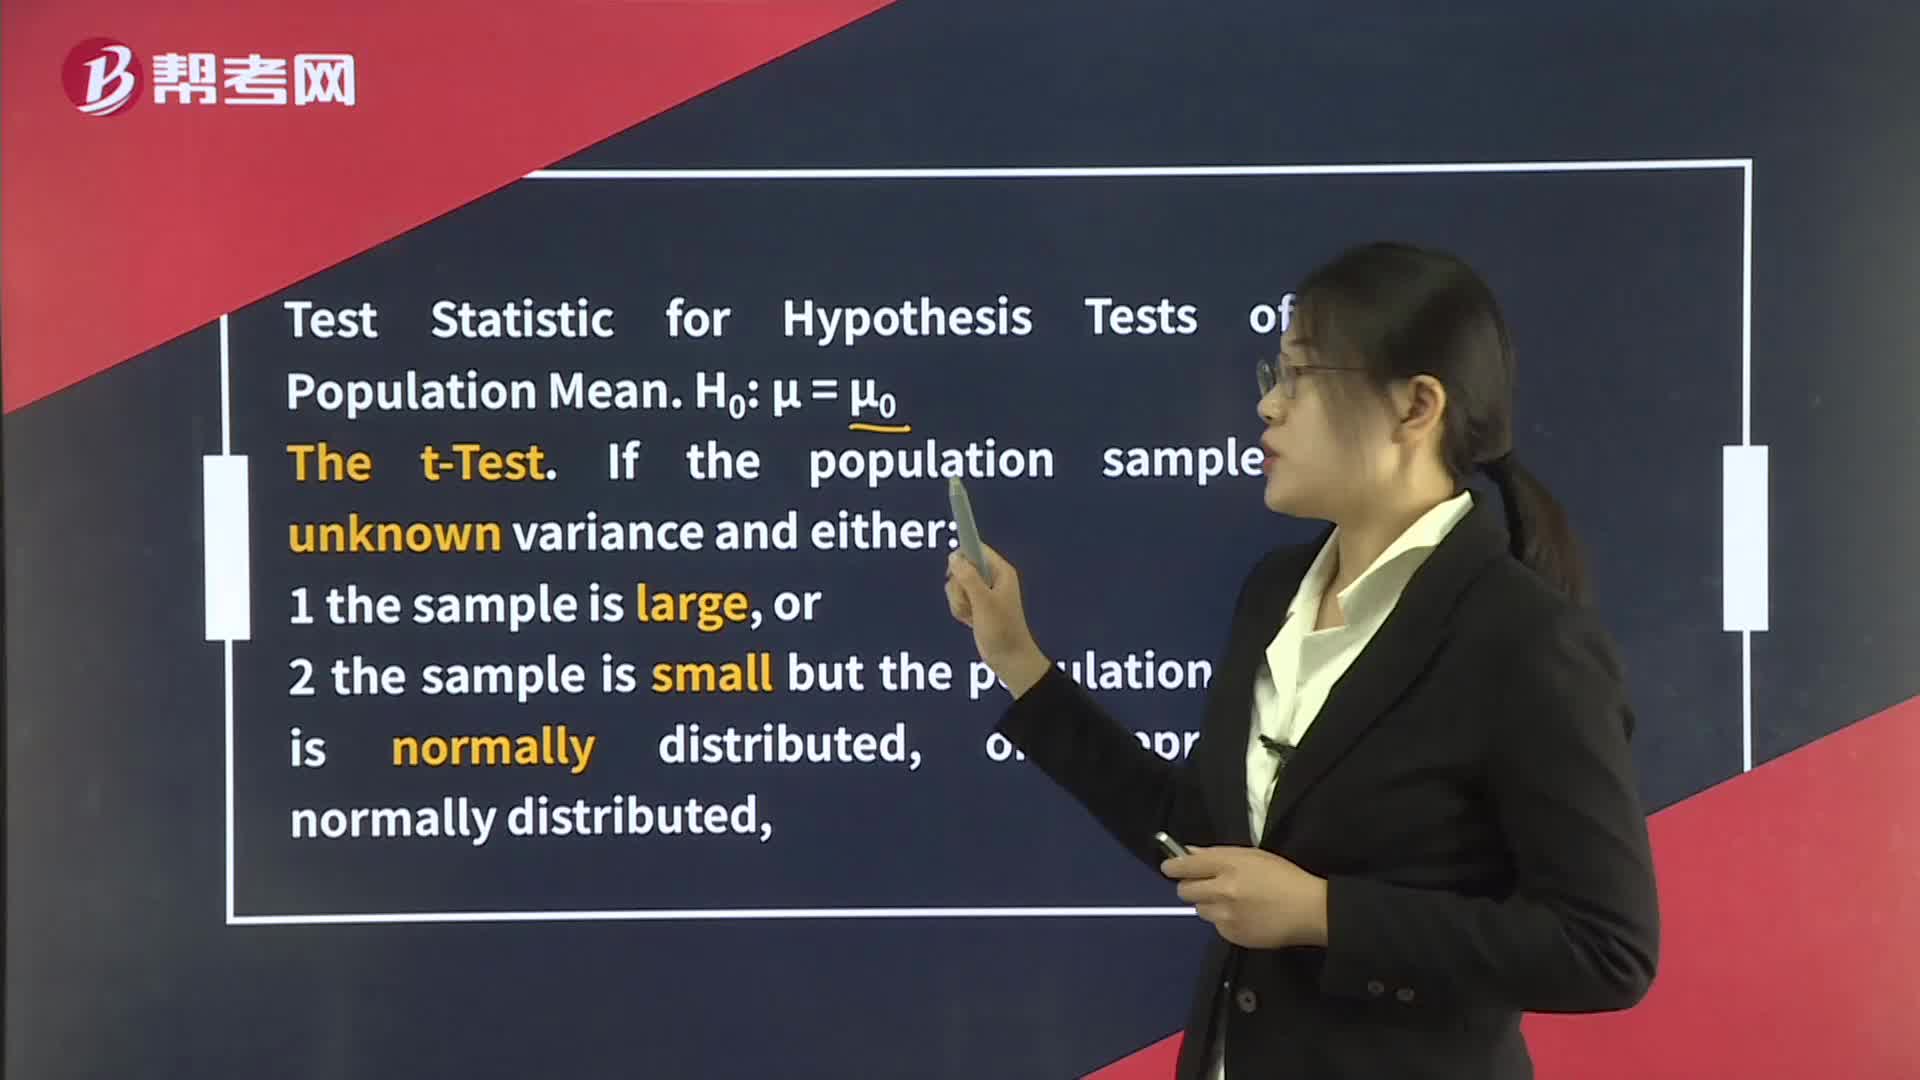
Hypothesis Tests Concerning the Mean
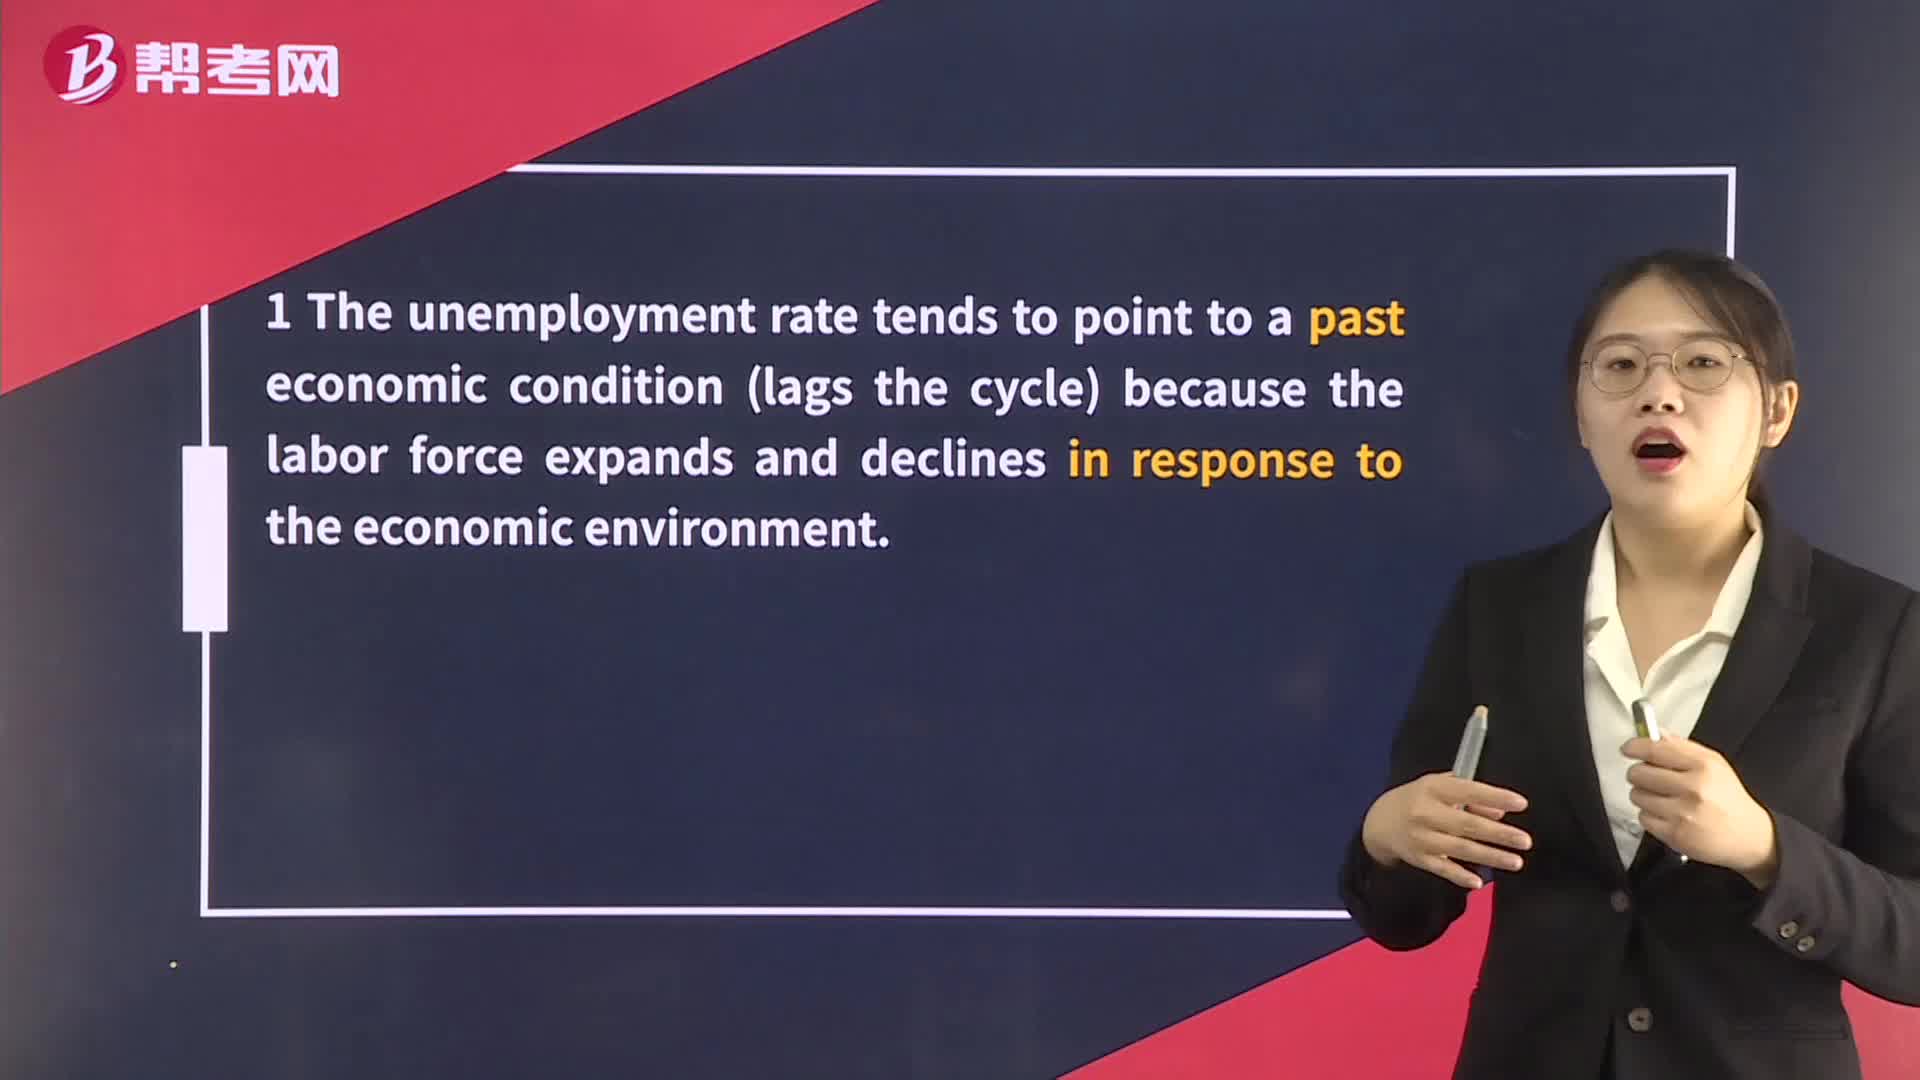
The Unemployment Rate
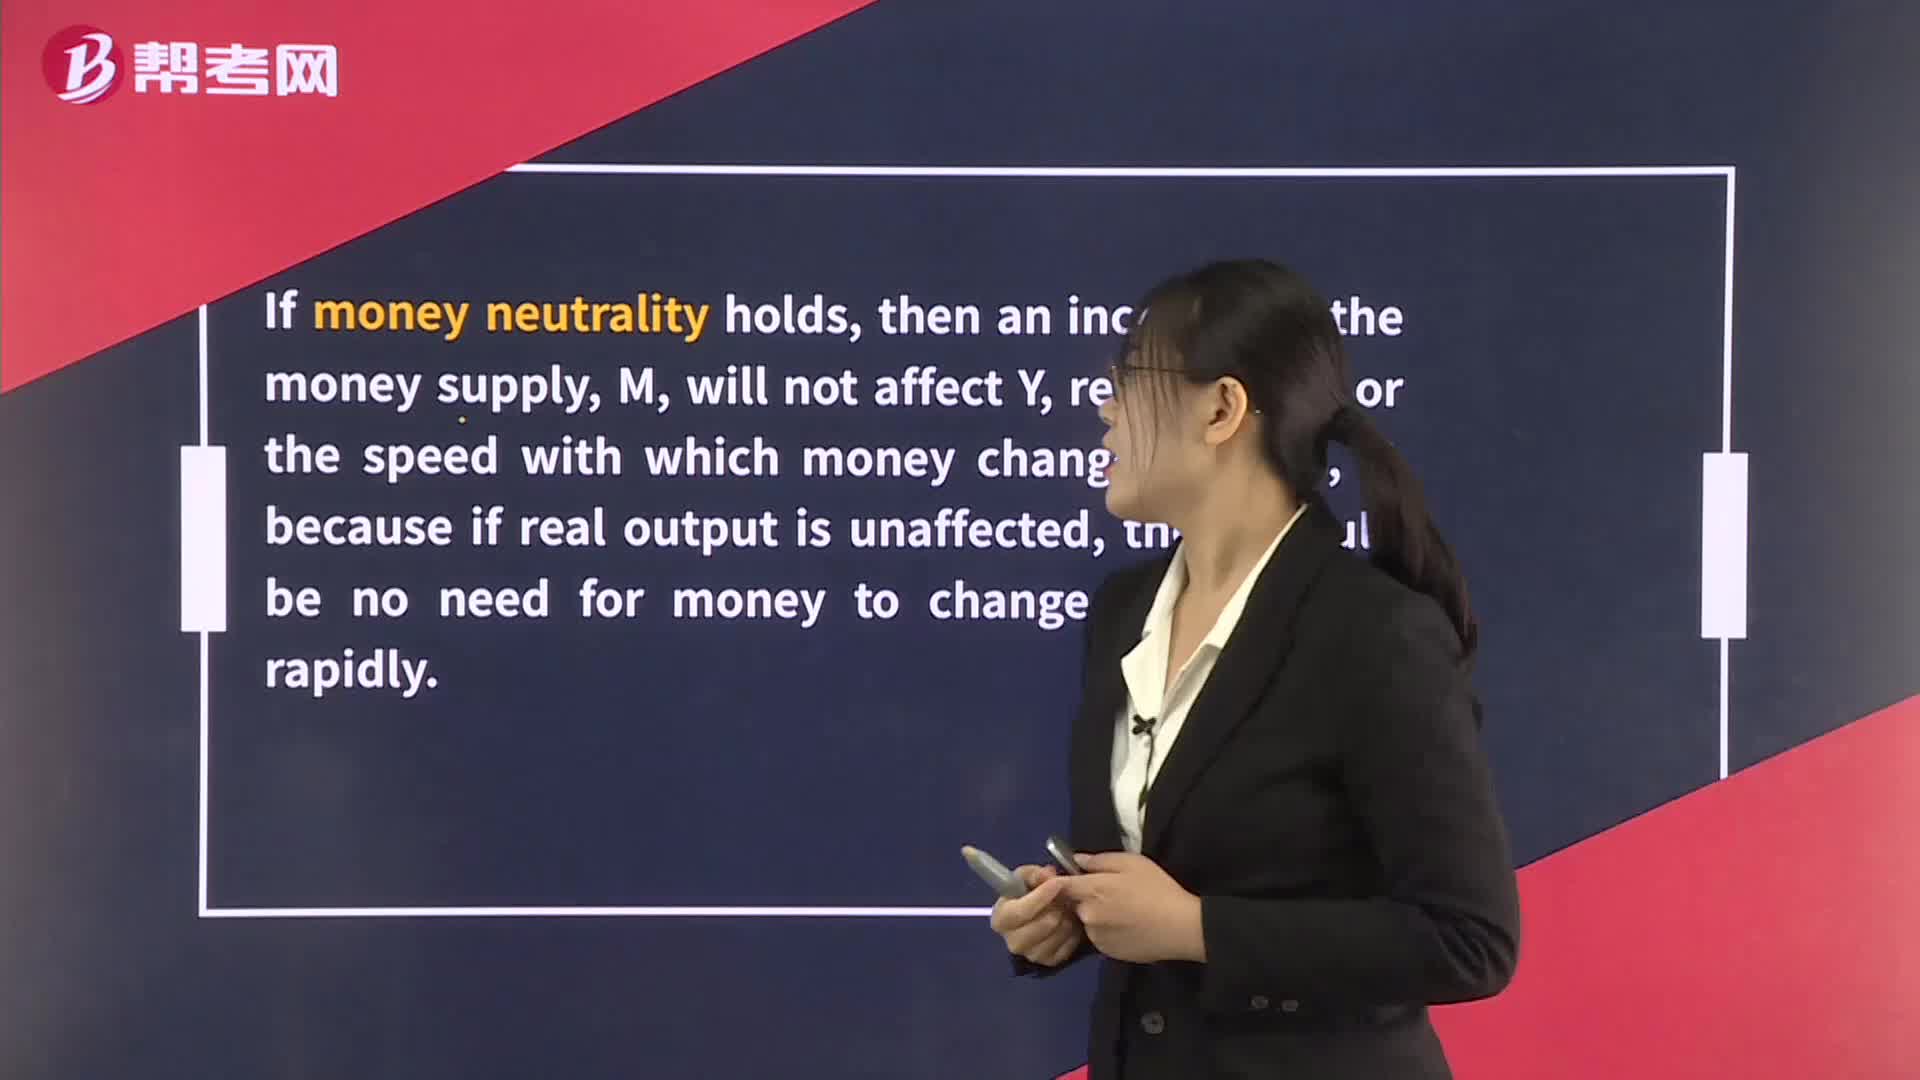
The Quantity Theory of Money
The Objectives of Monetary Policy