
CFA考試相關(guān)視頻

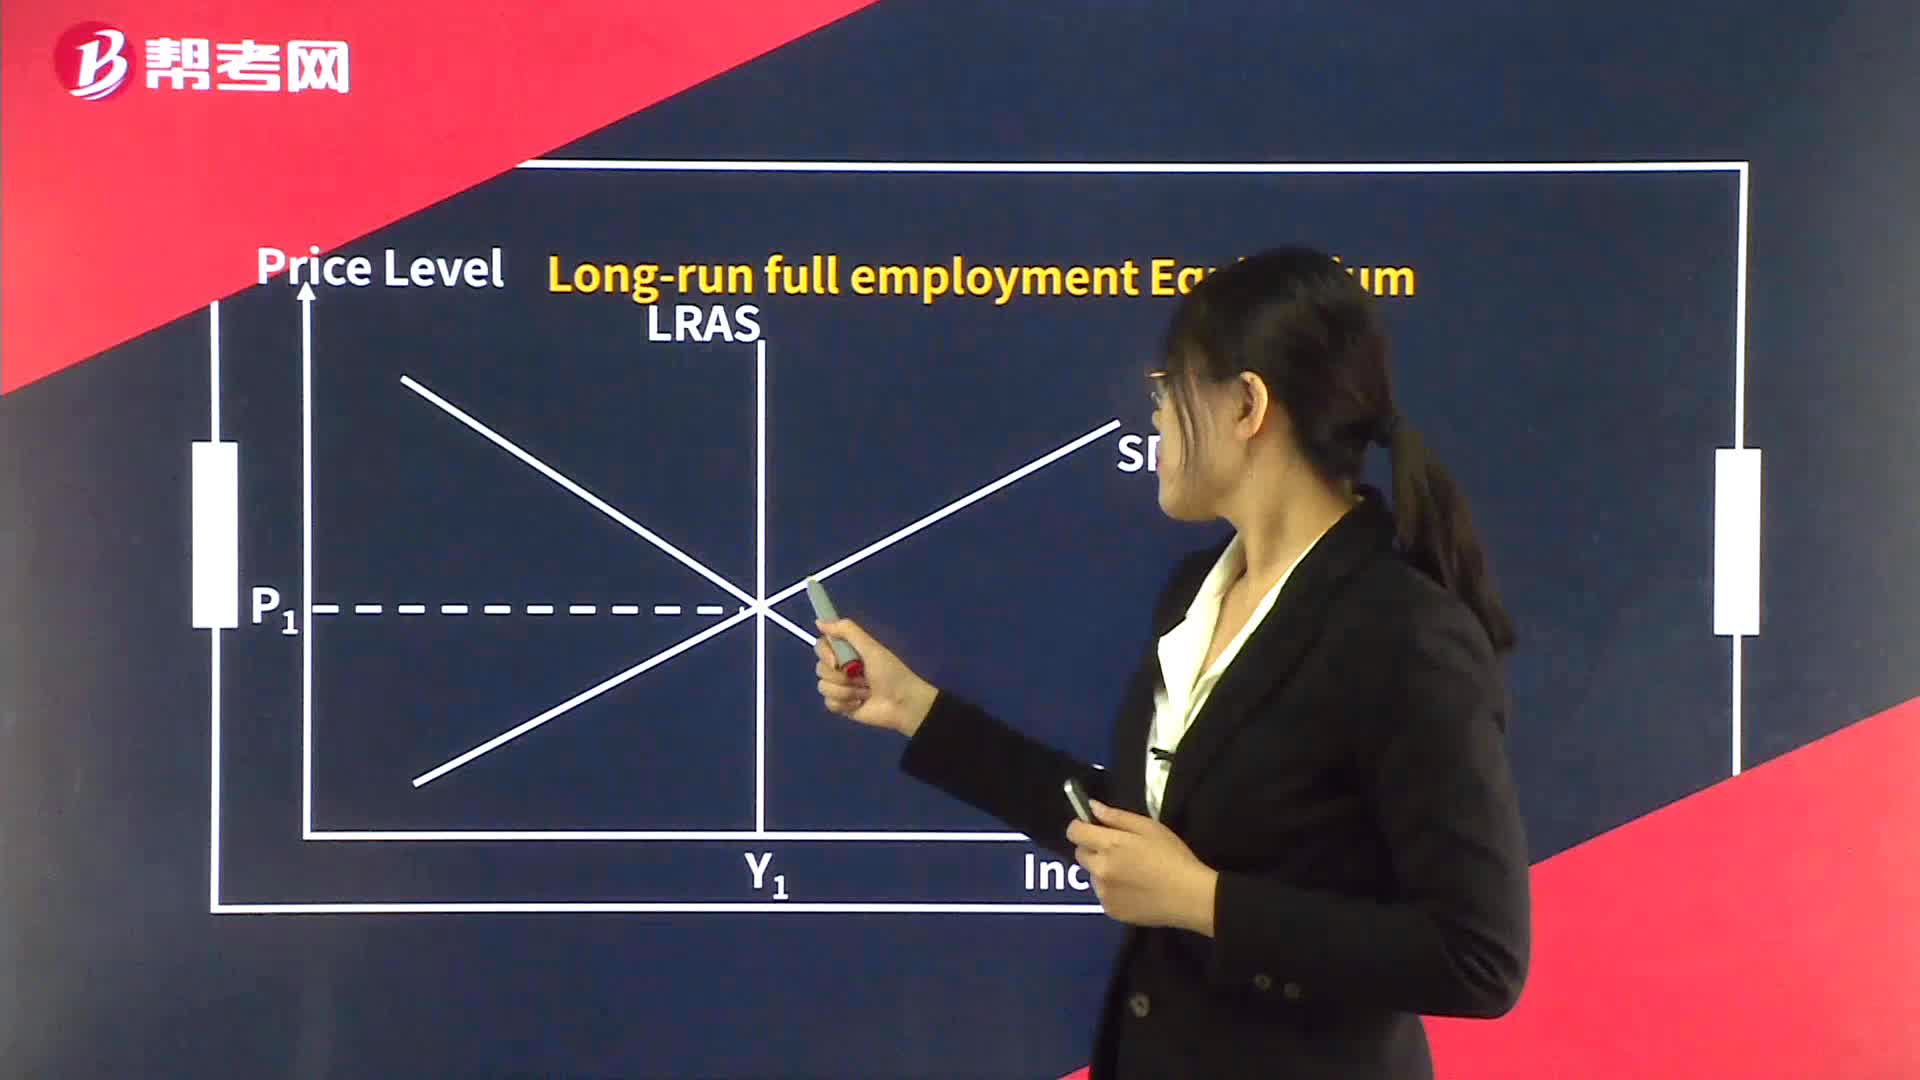
How to explain Run Aggregate Supply Curve?
What does Run Aggregate Supply Curve mean?
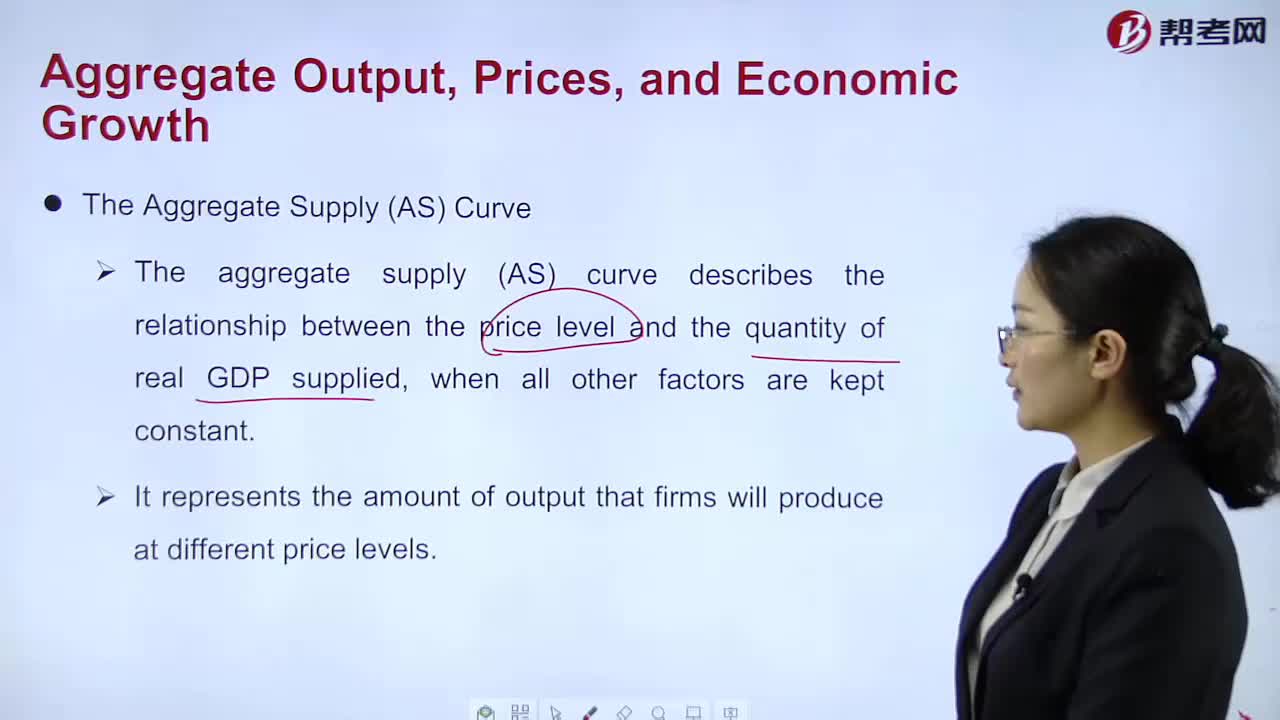
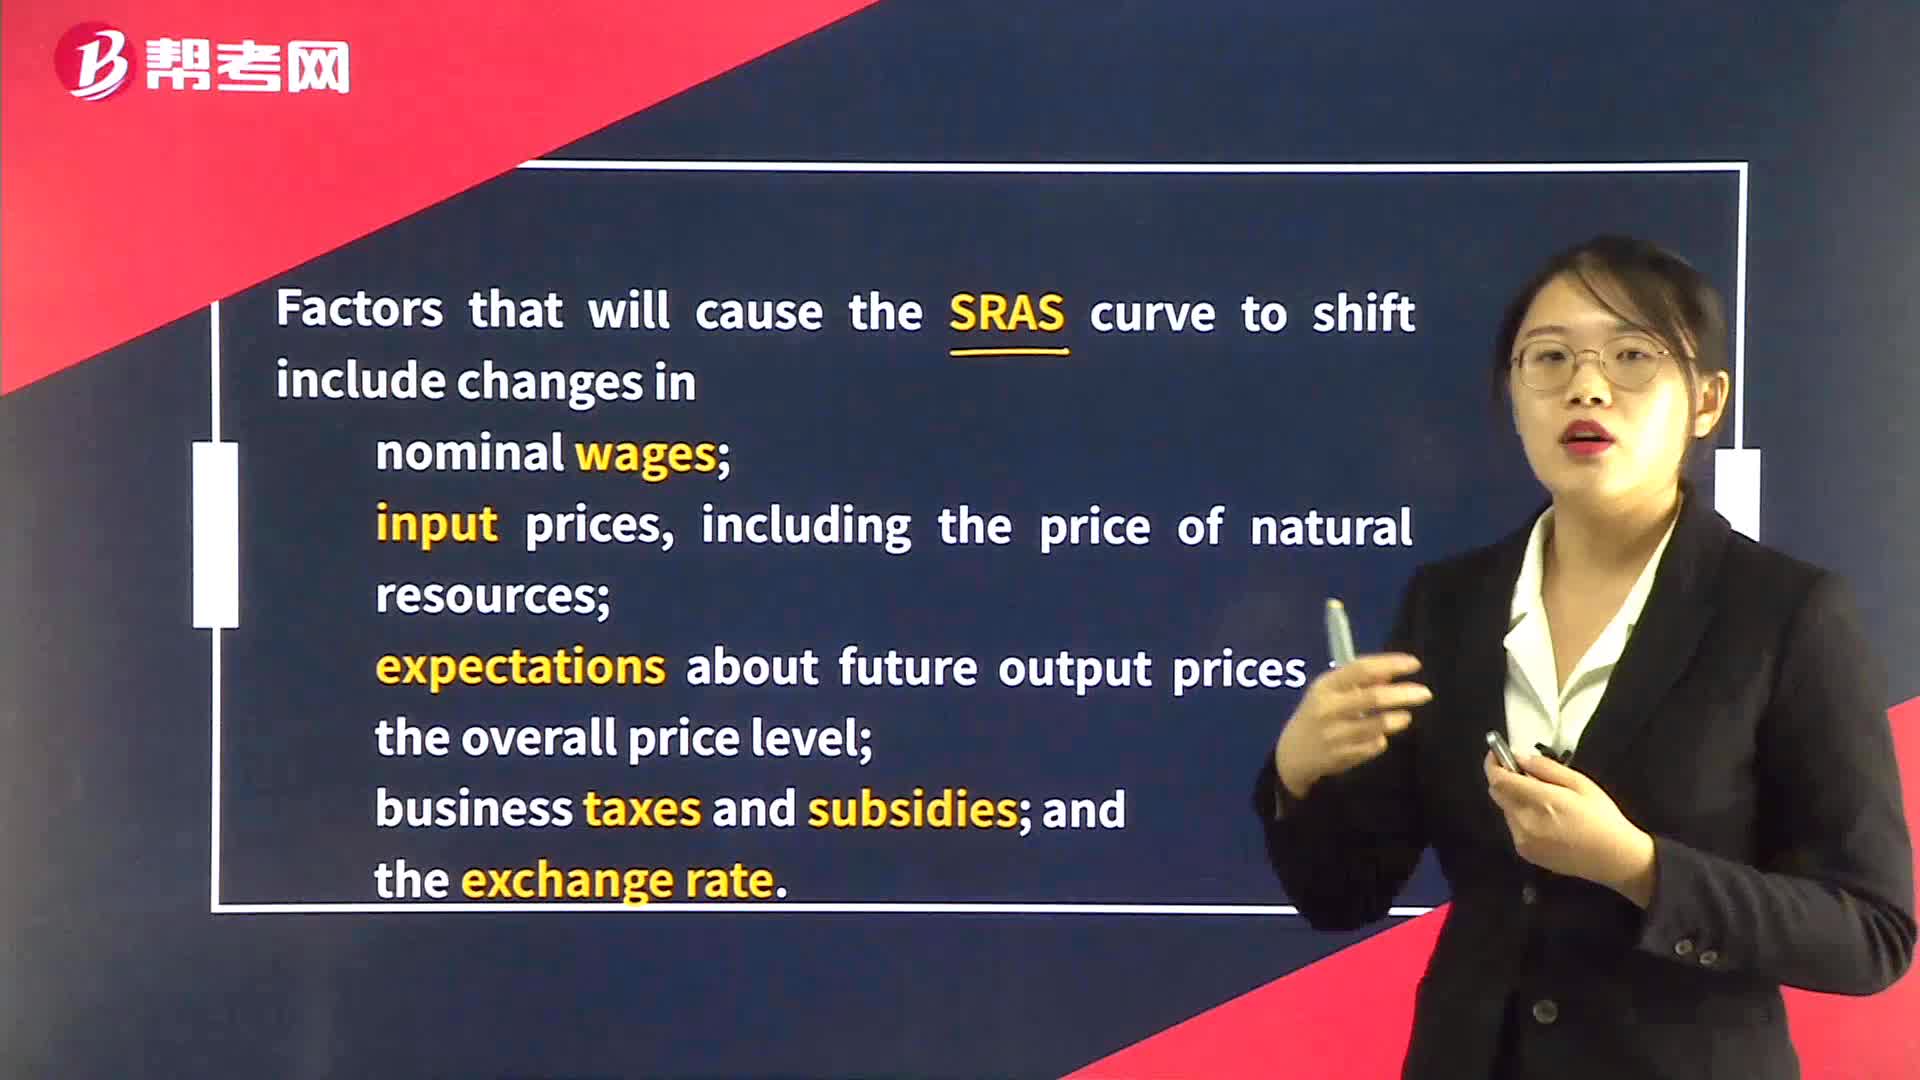
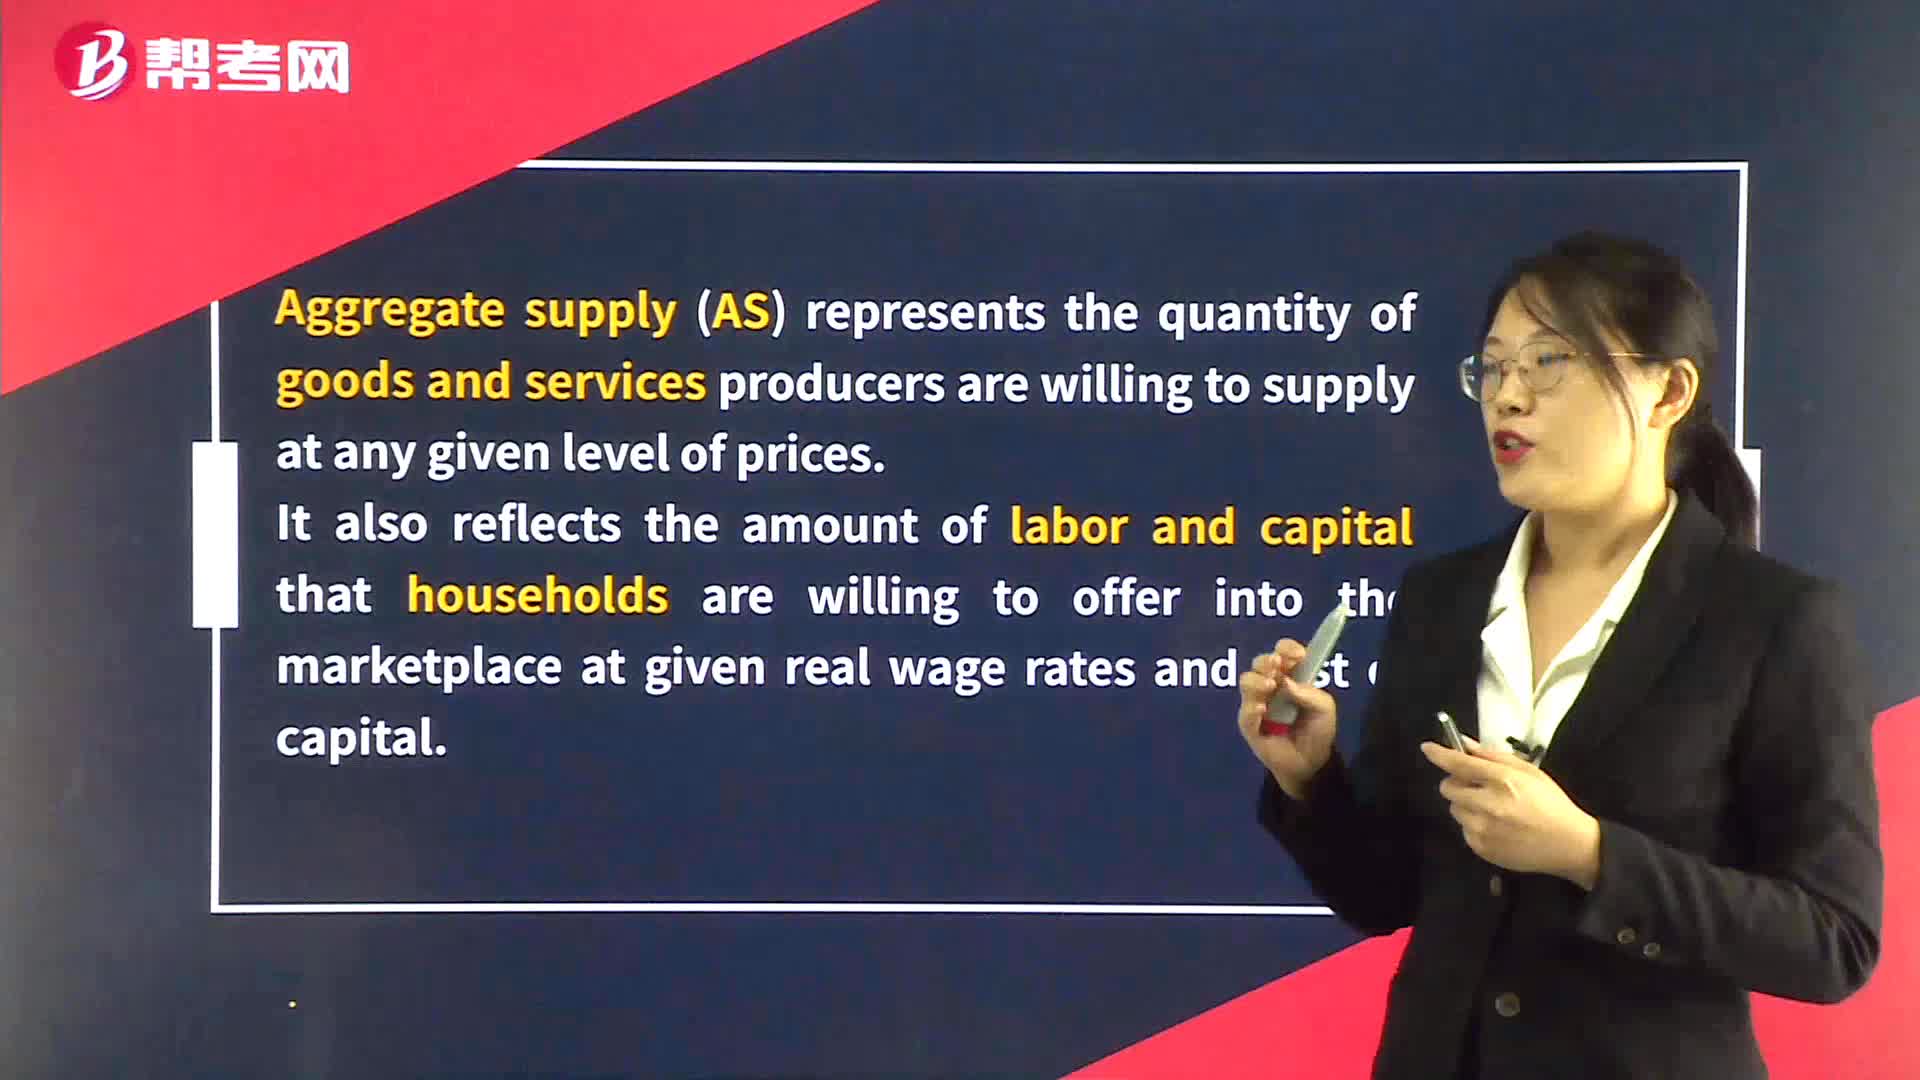
How to understand The Aggregate Supply (AS) Curve?
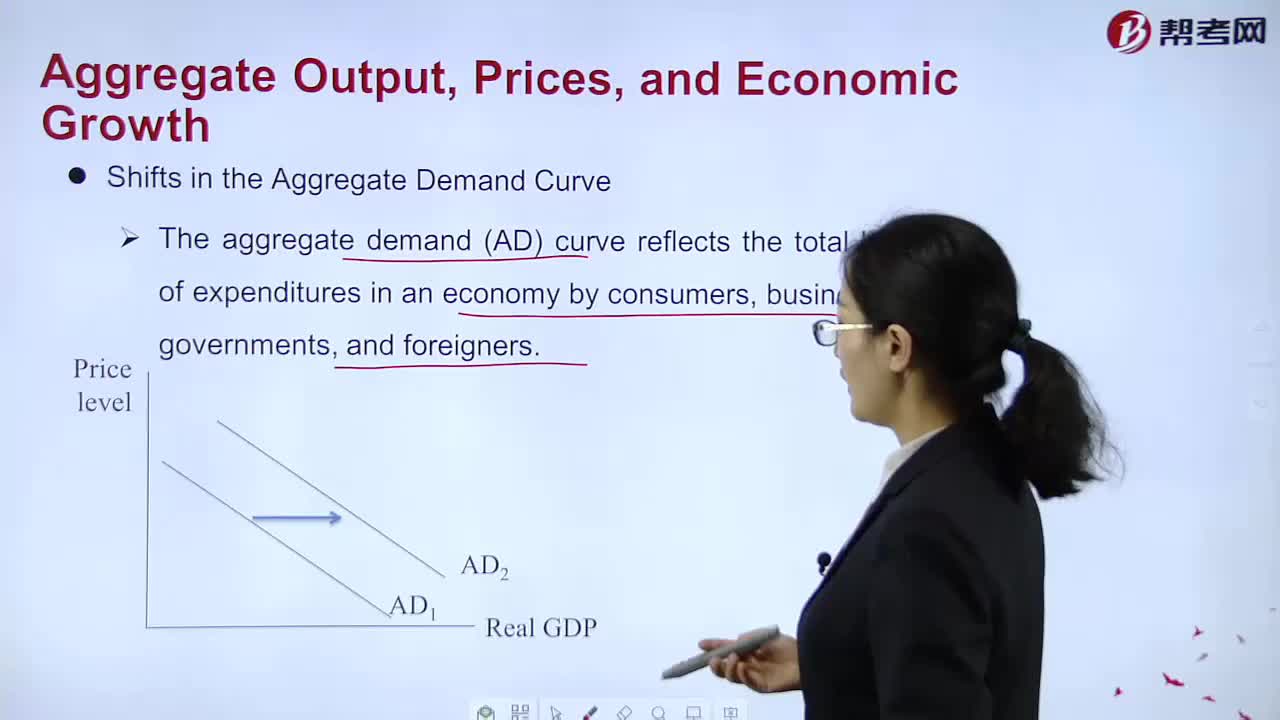
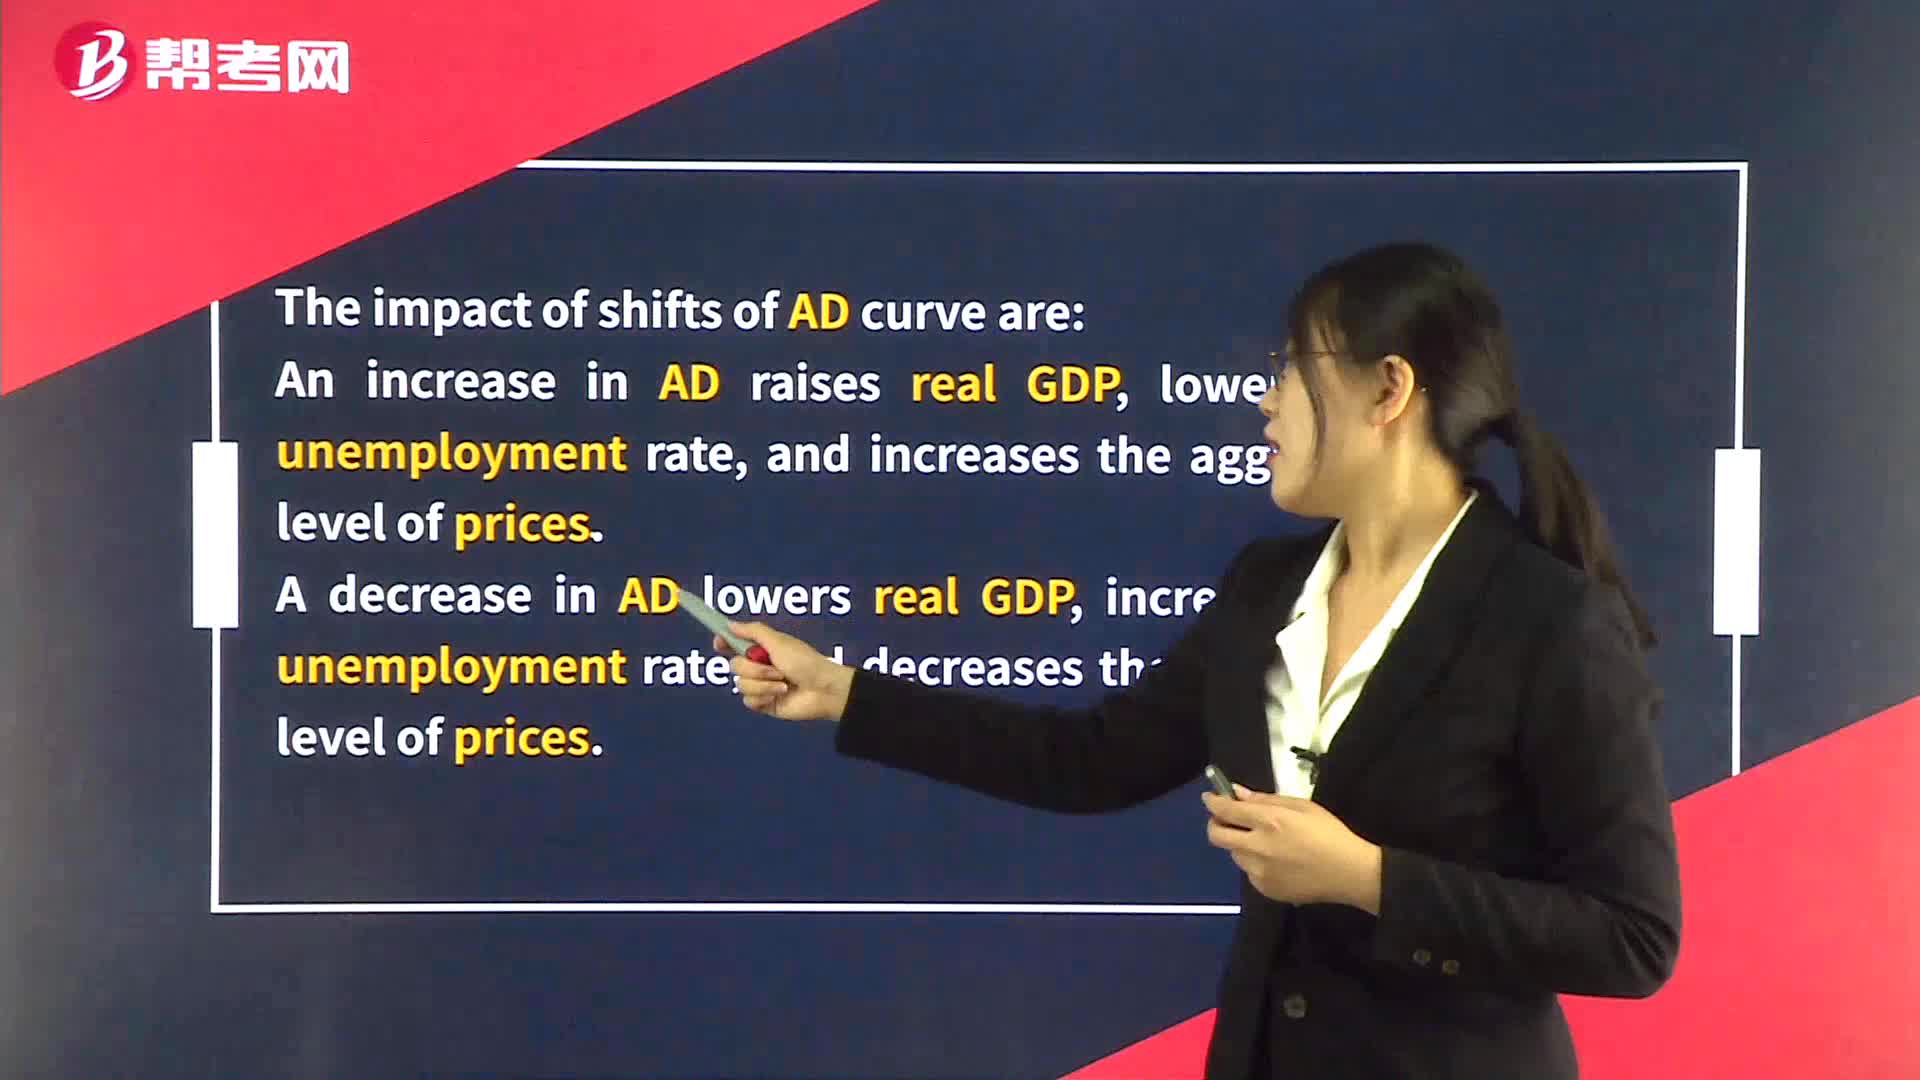
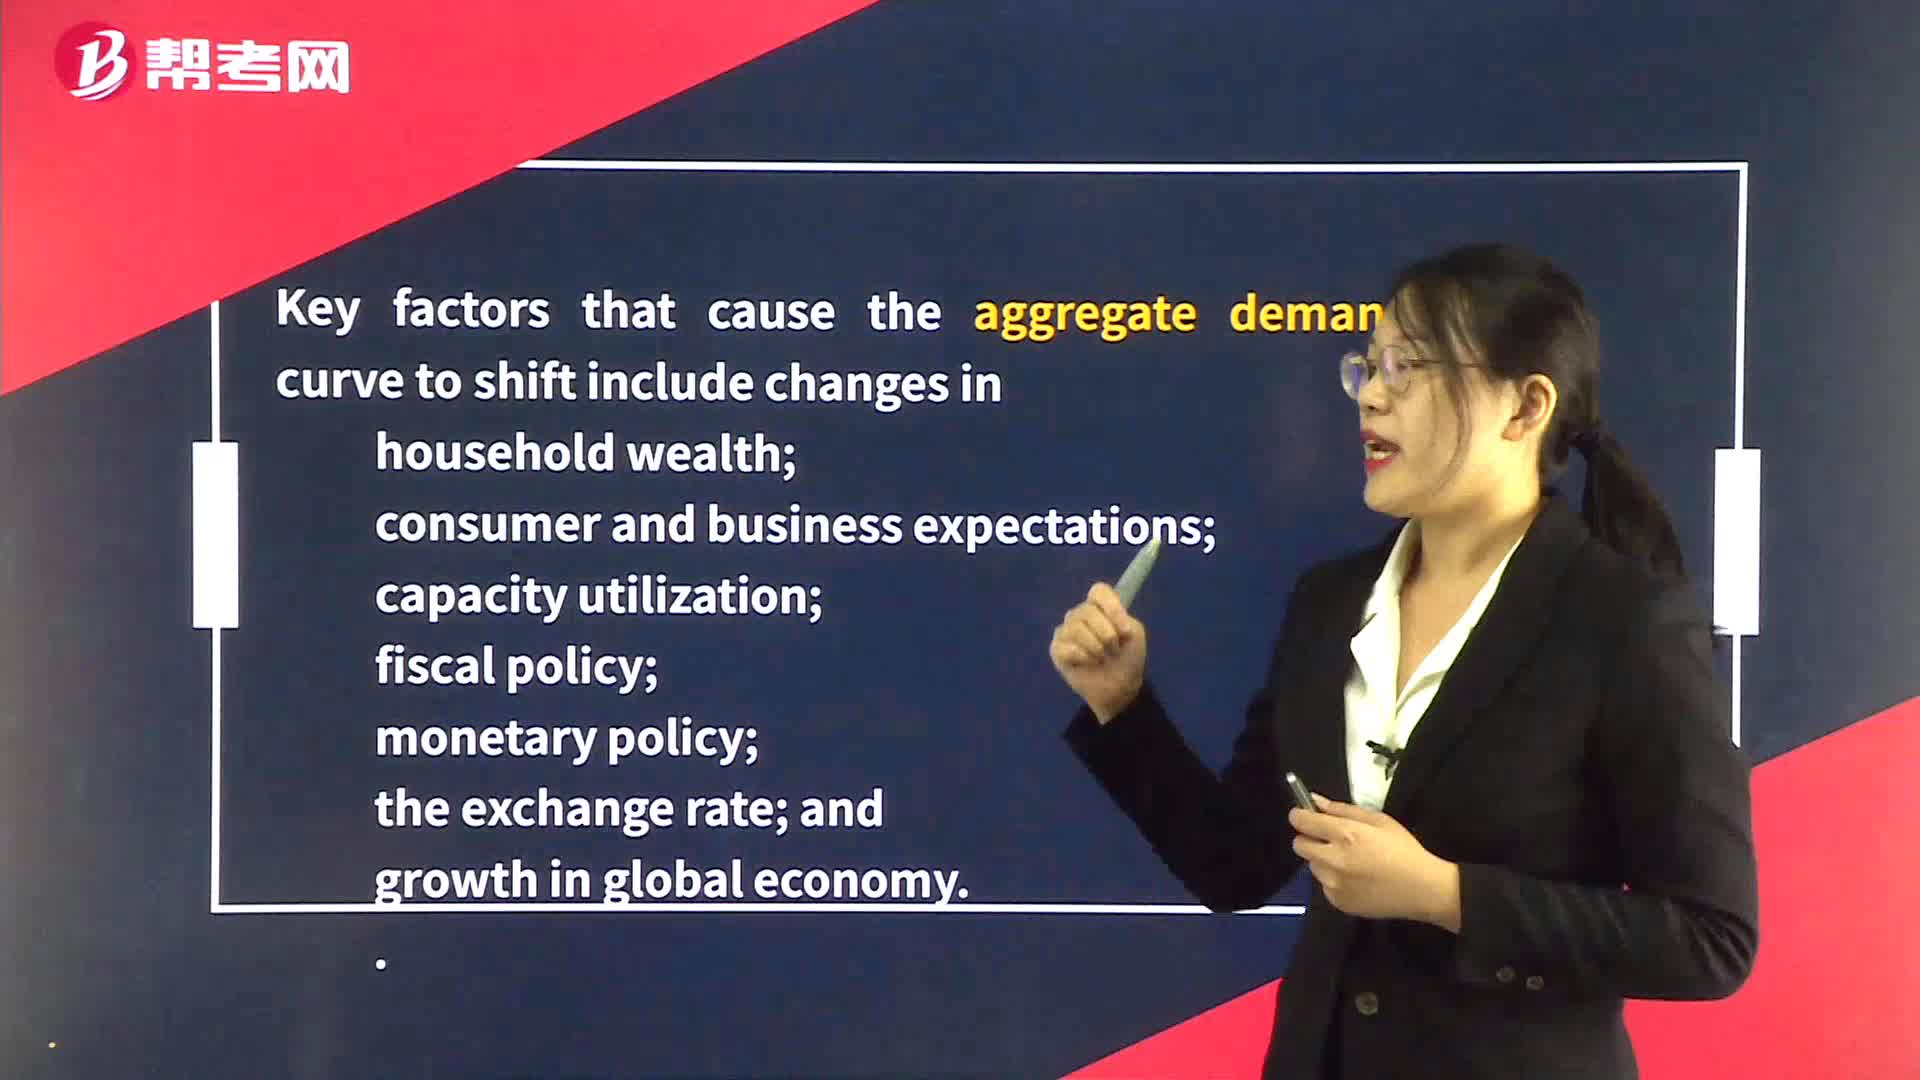
How to master Shifts in the Aggregate Demand Curve?
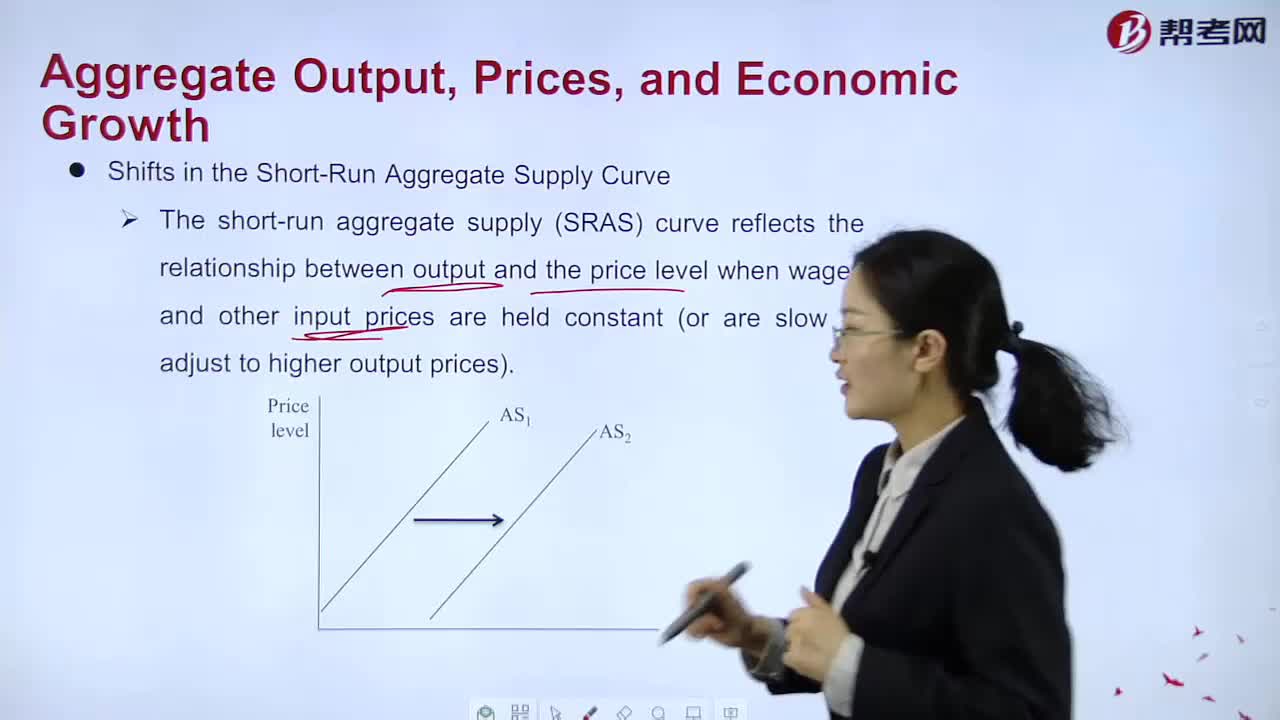
How to understand Aggregate Demand, Aggregate Supply, and Equilibrium(2)?
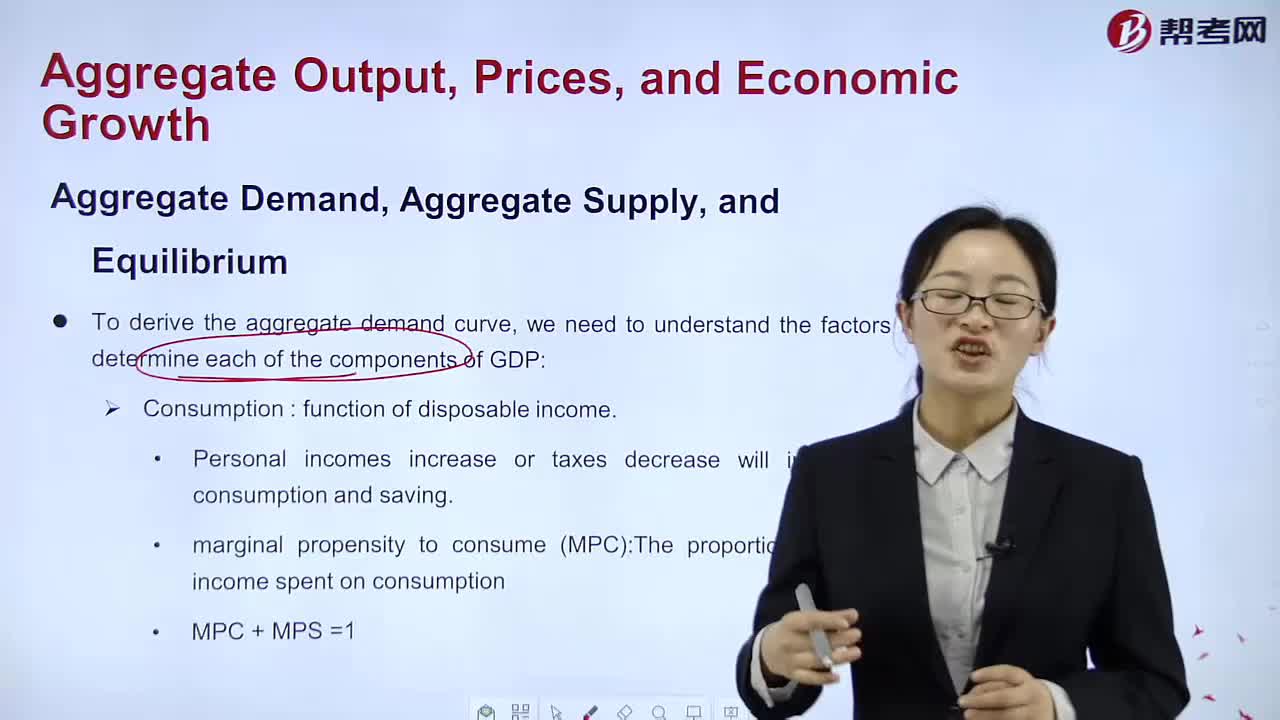
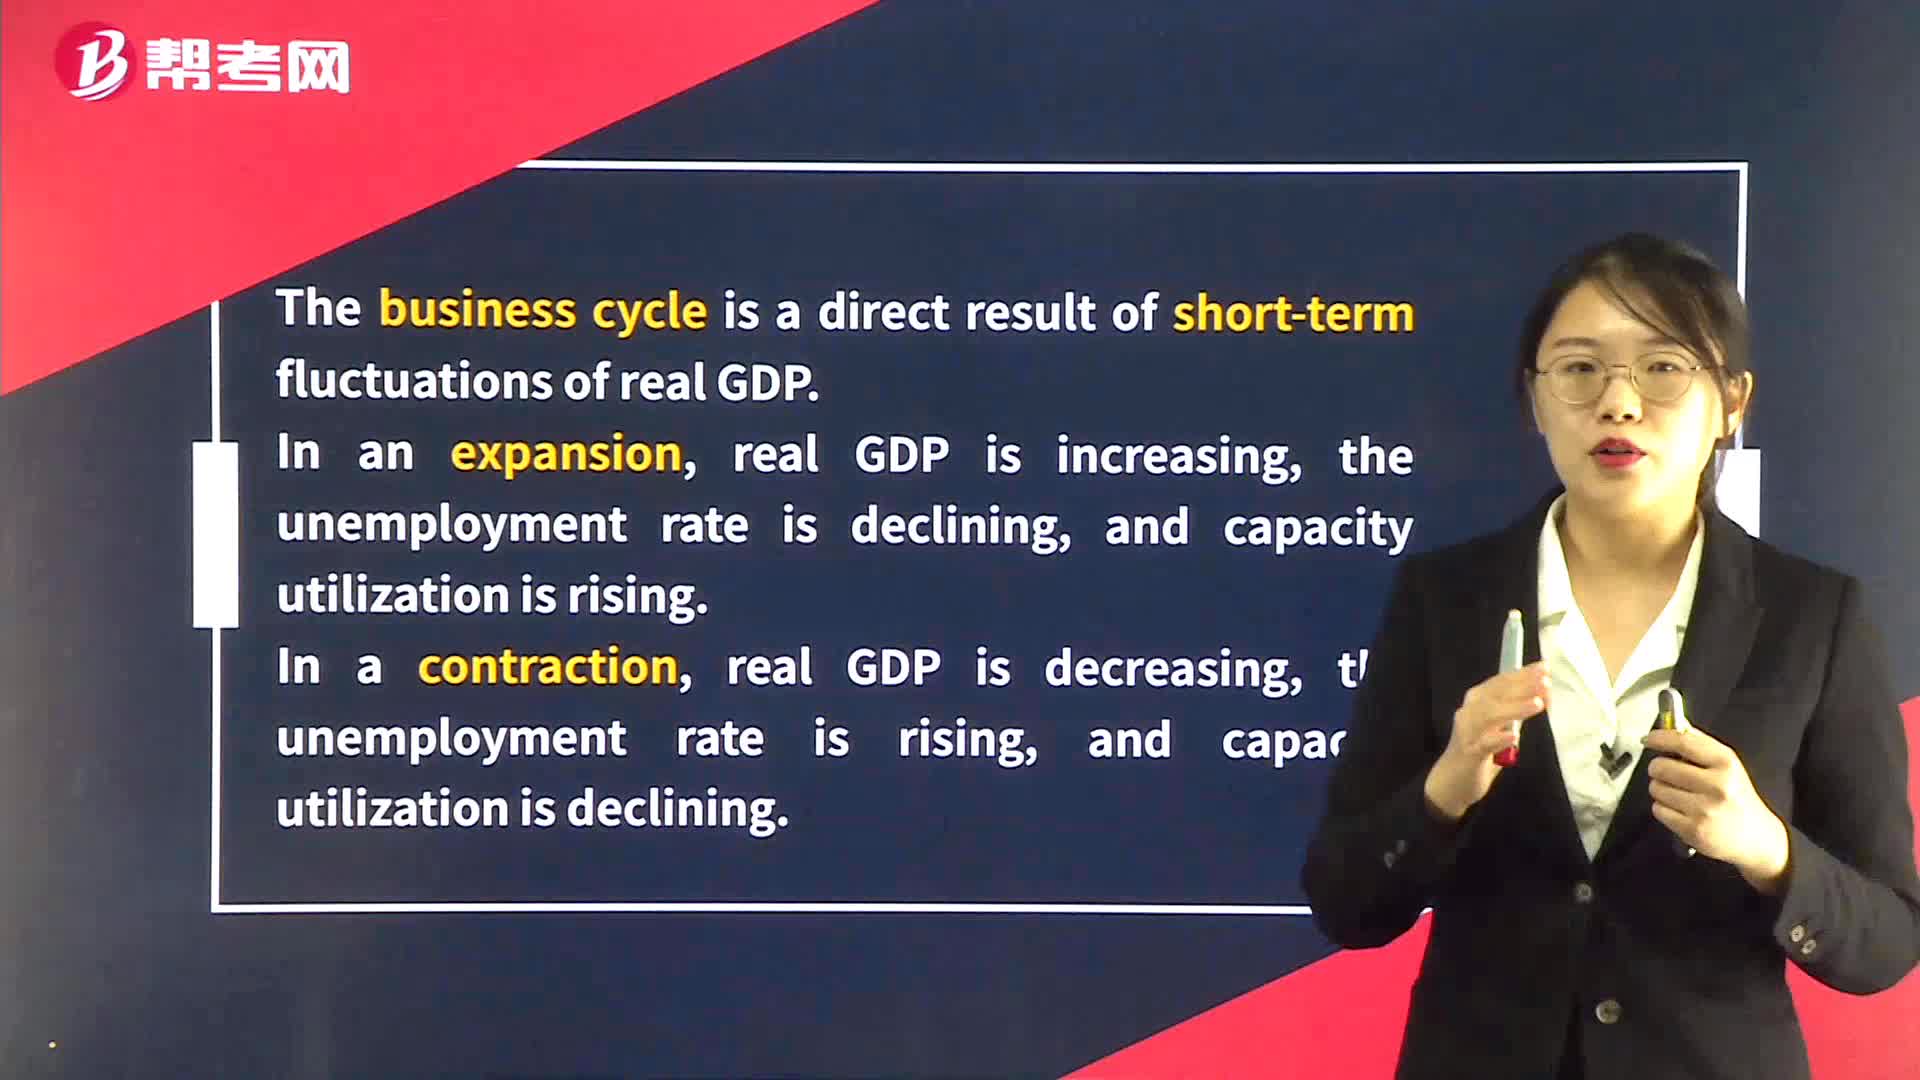
How to master Aggregate Demand, Aggregate Supply, and Equilibrium(1)?

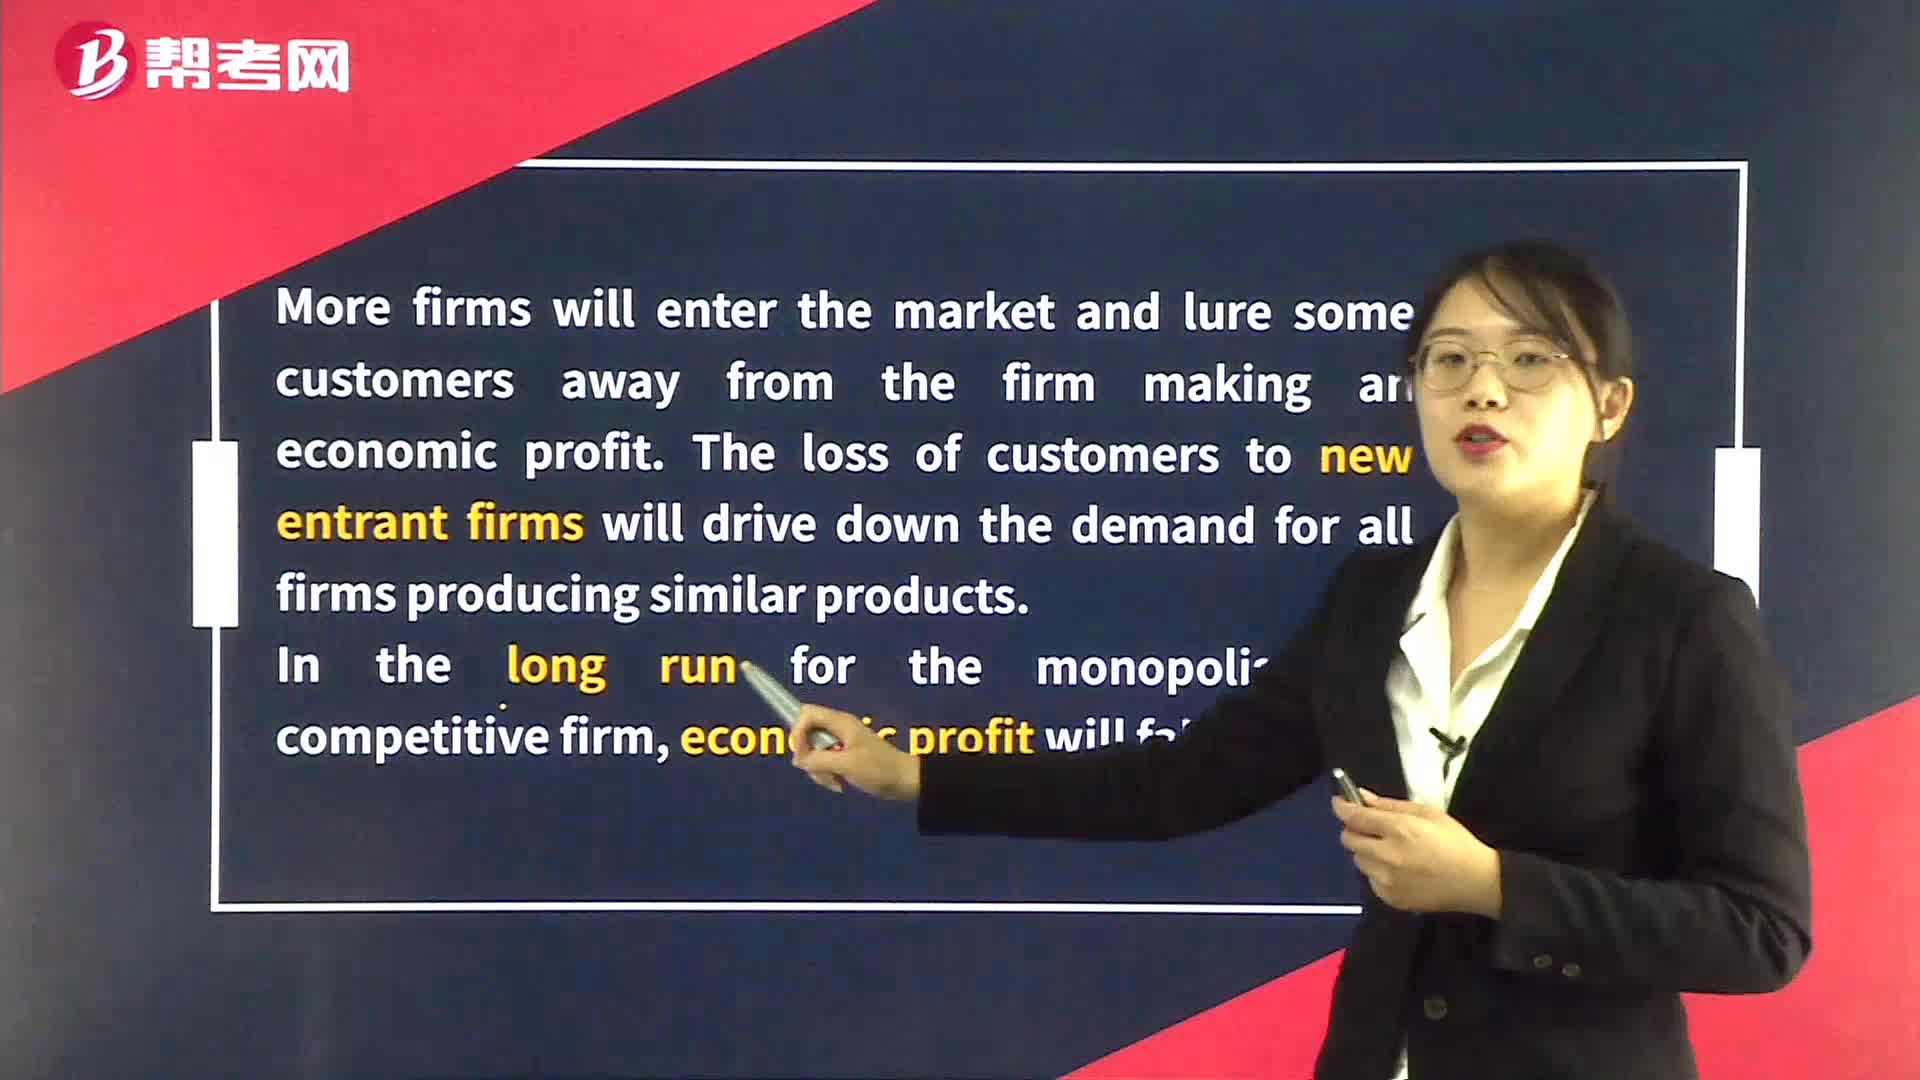
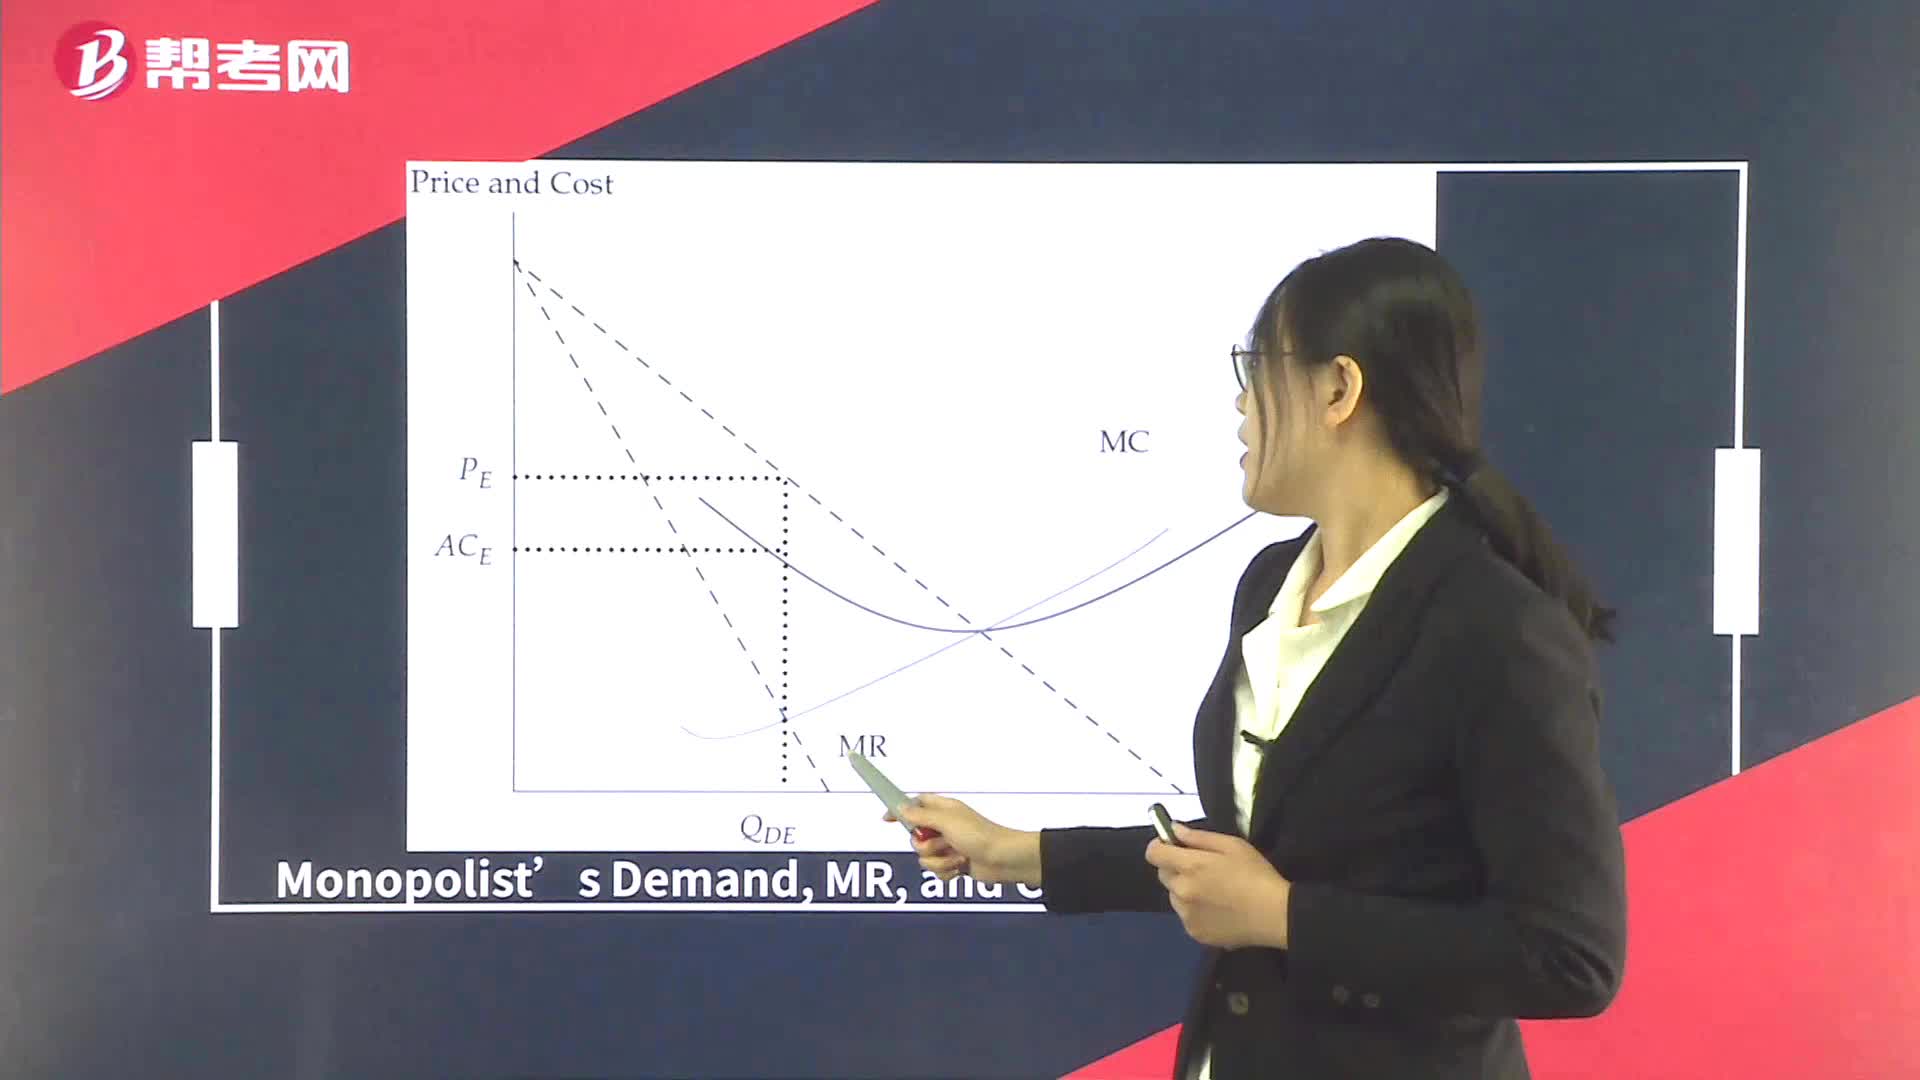
Monopolistic competition?
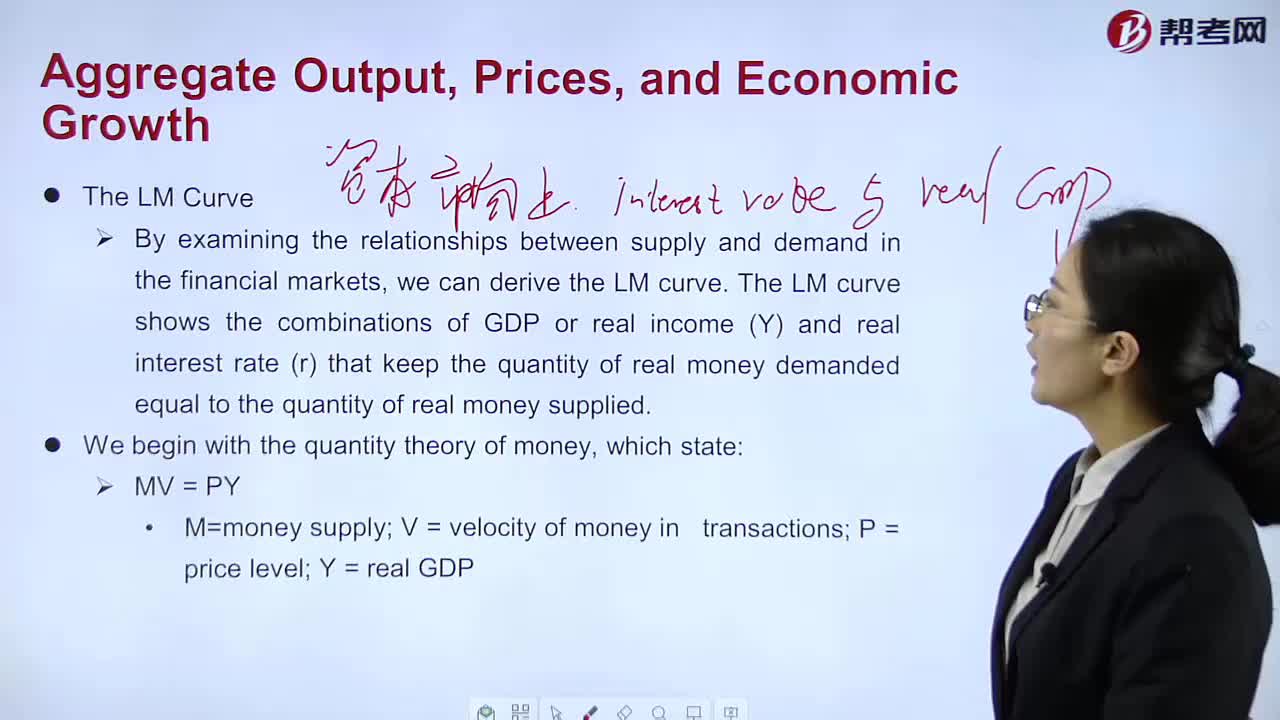
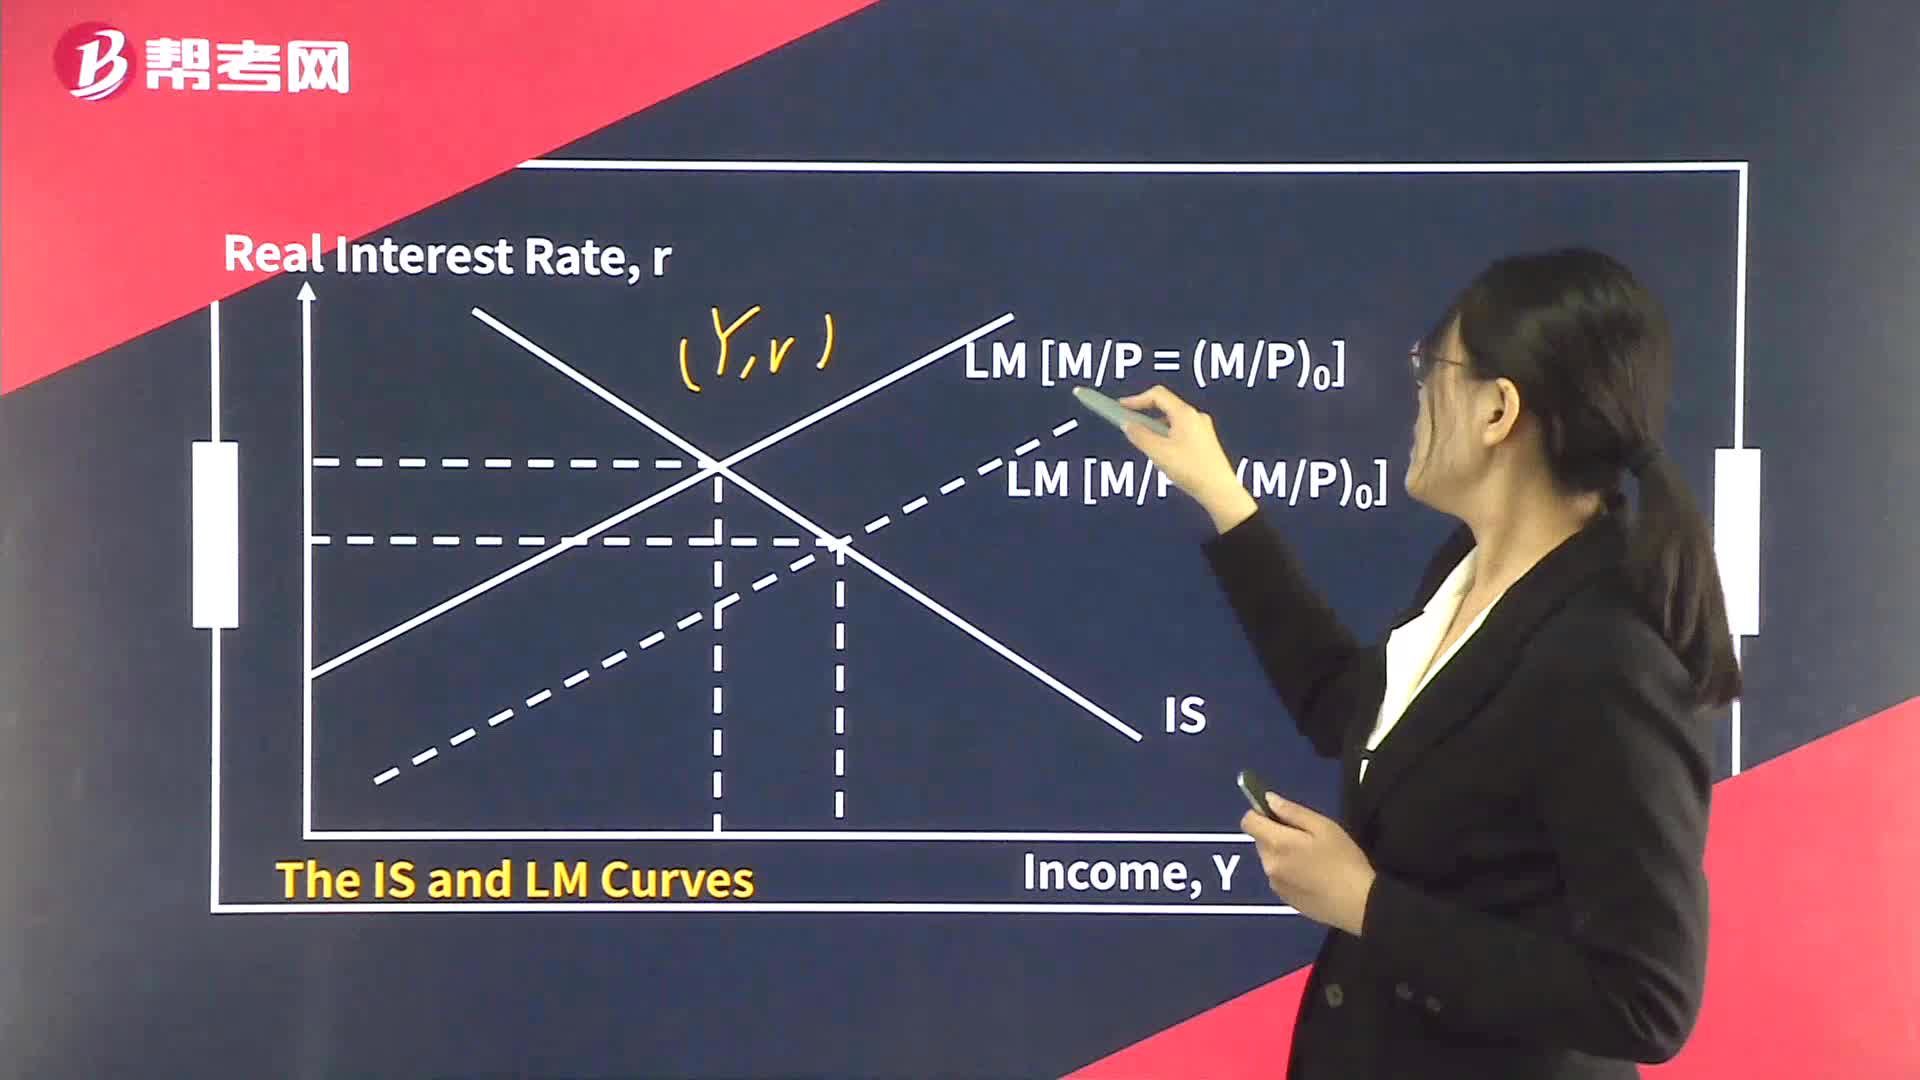
The LM Curve
The IS Curve
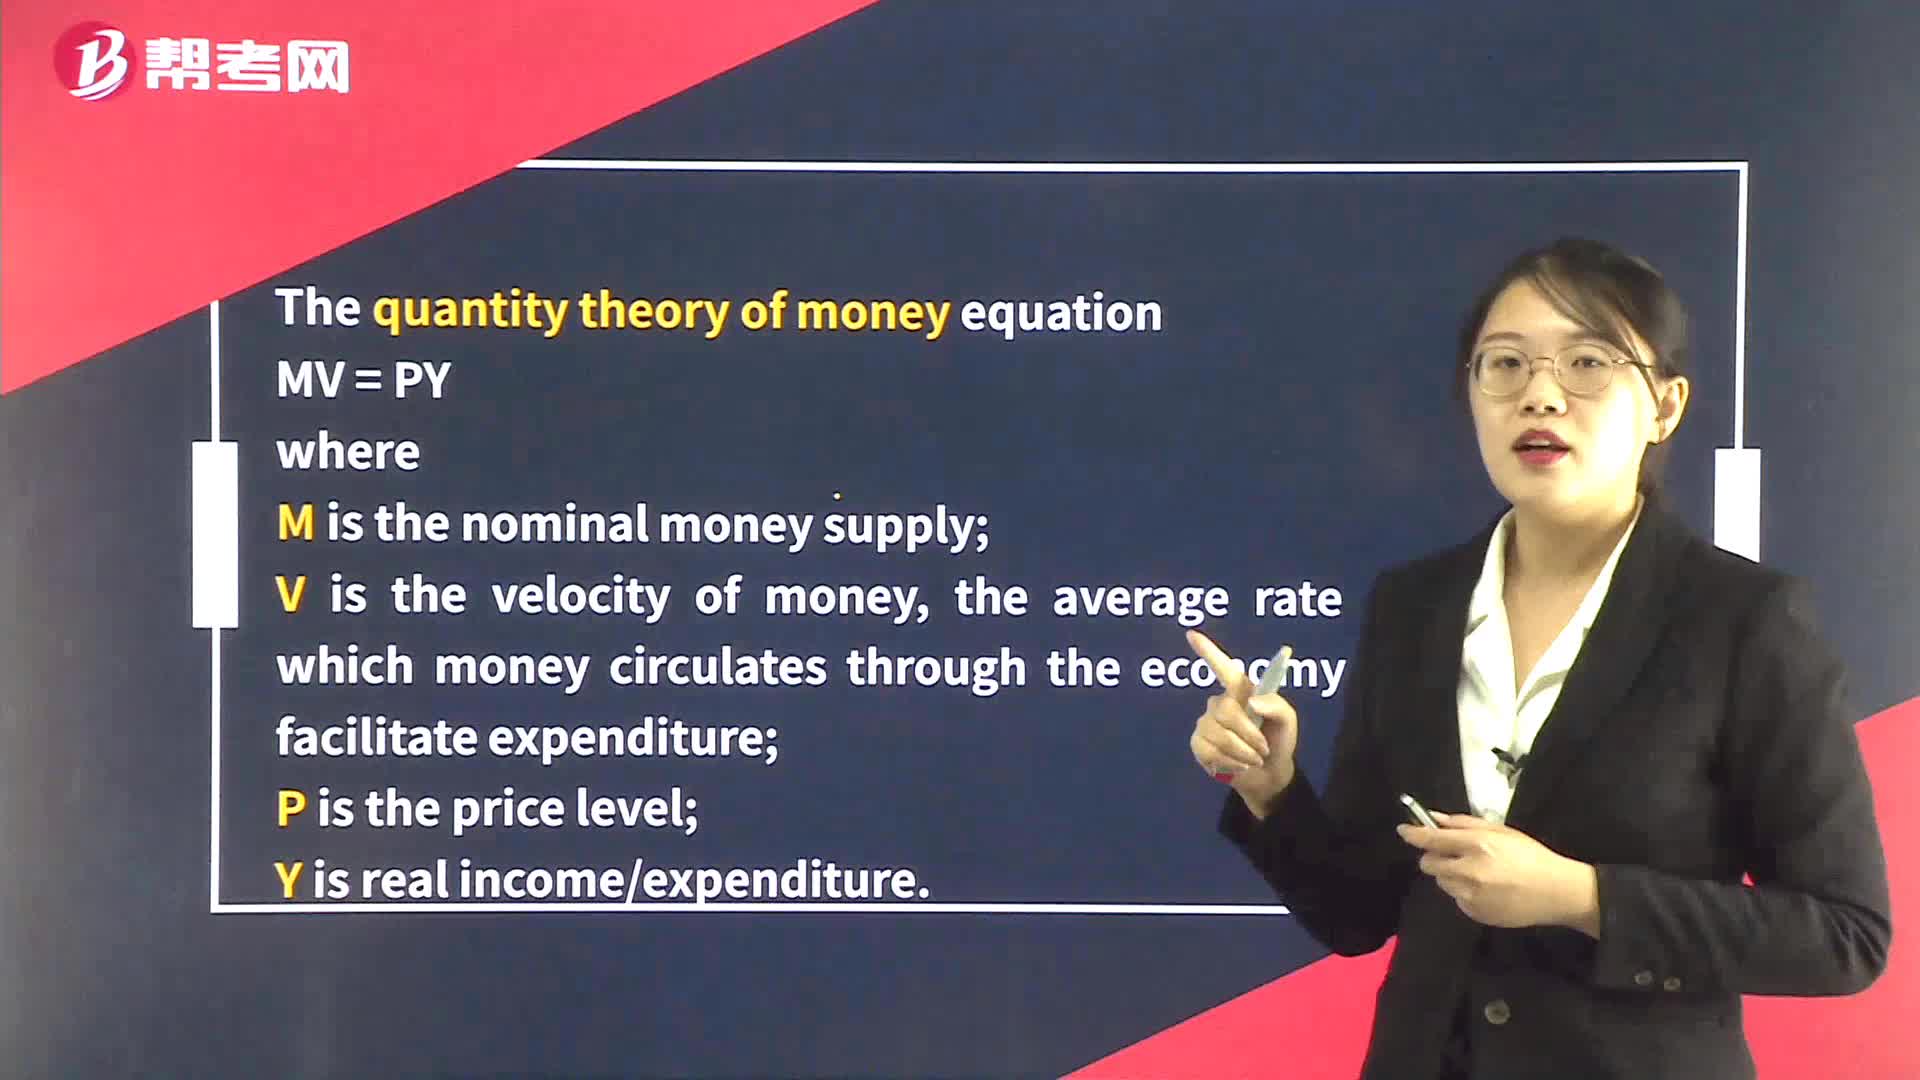
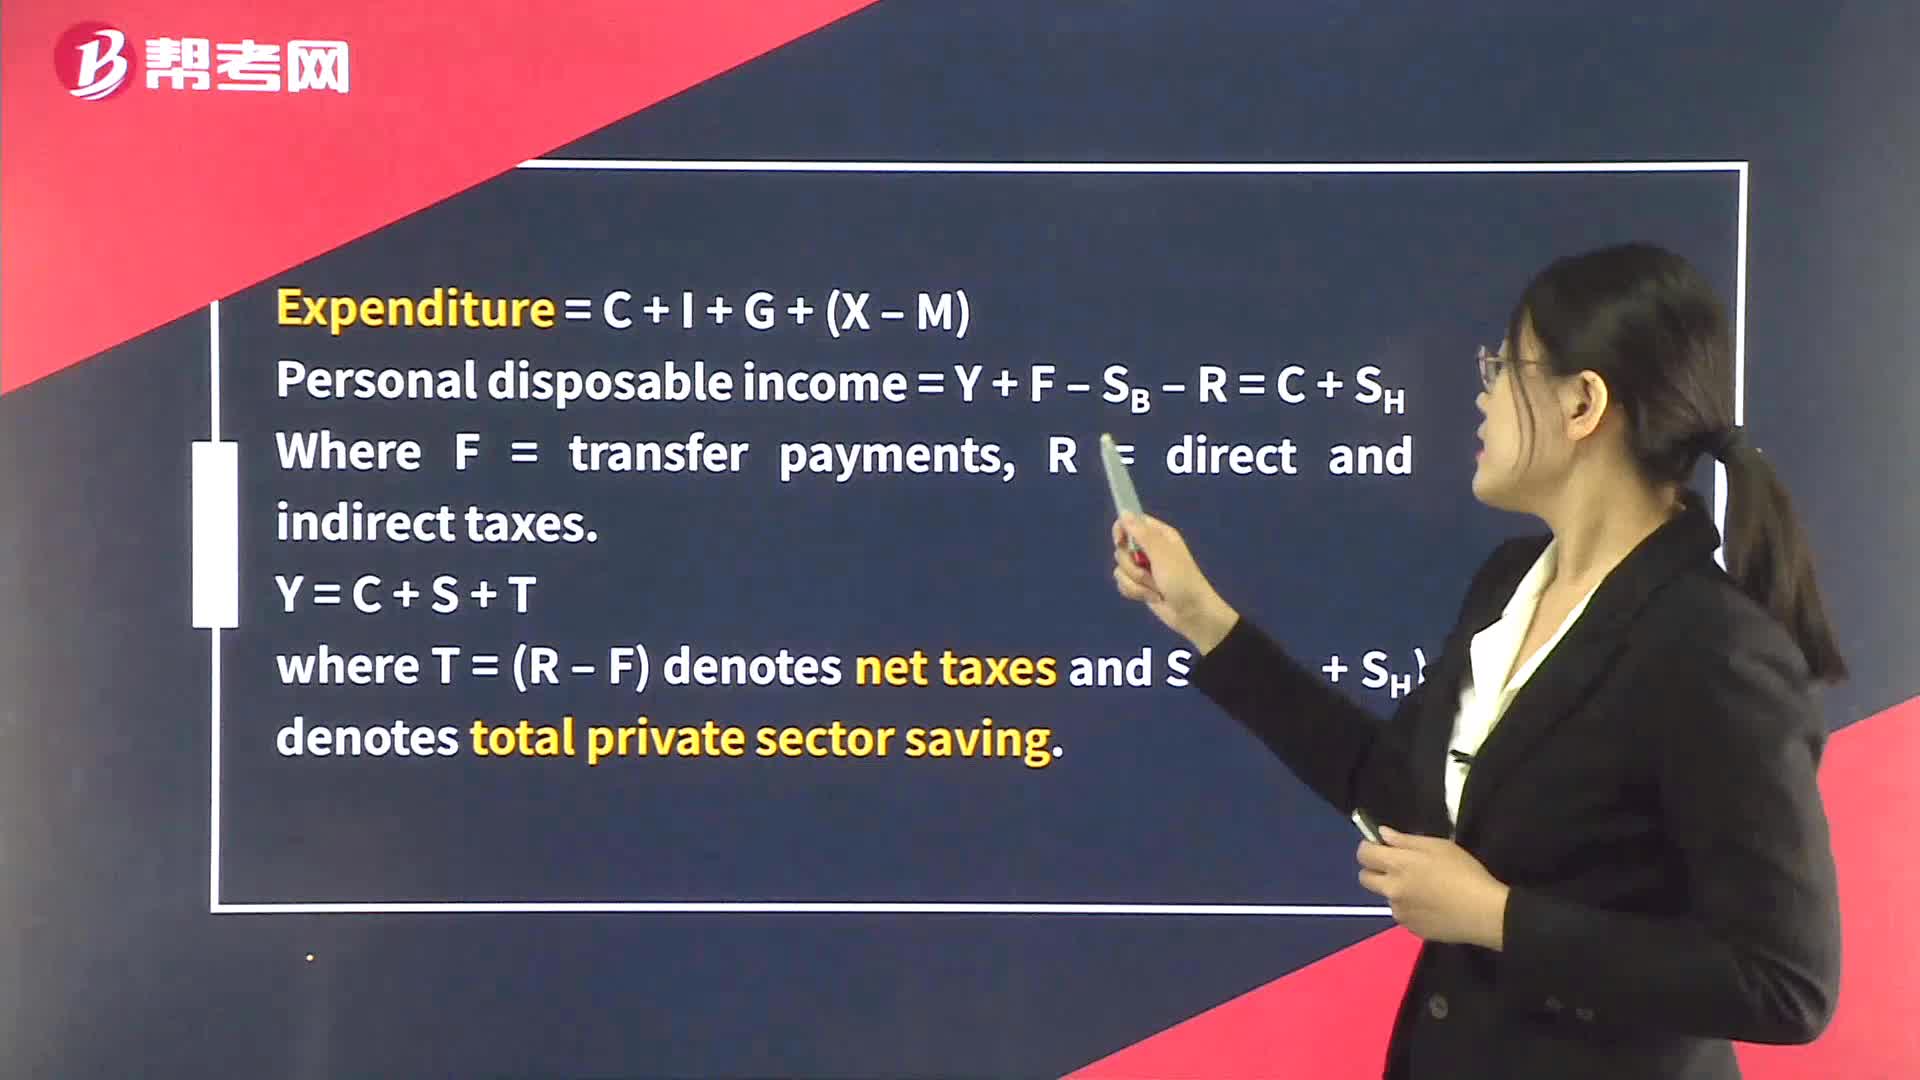
The Aggregate Demand Curve
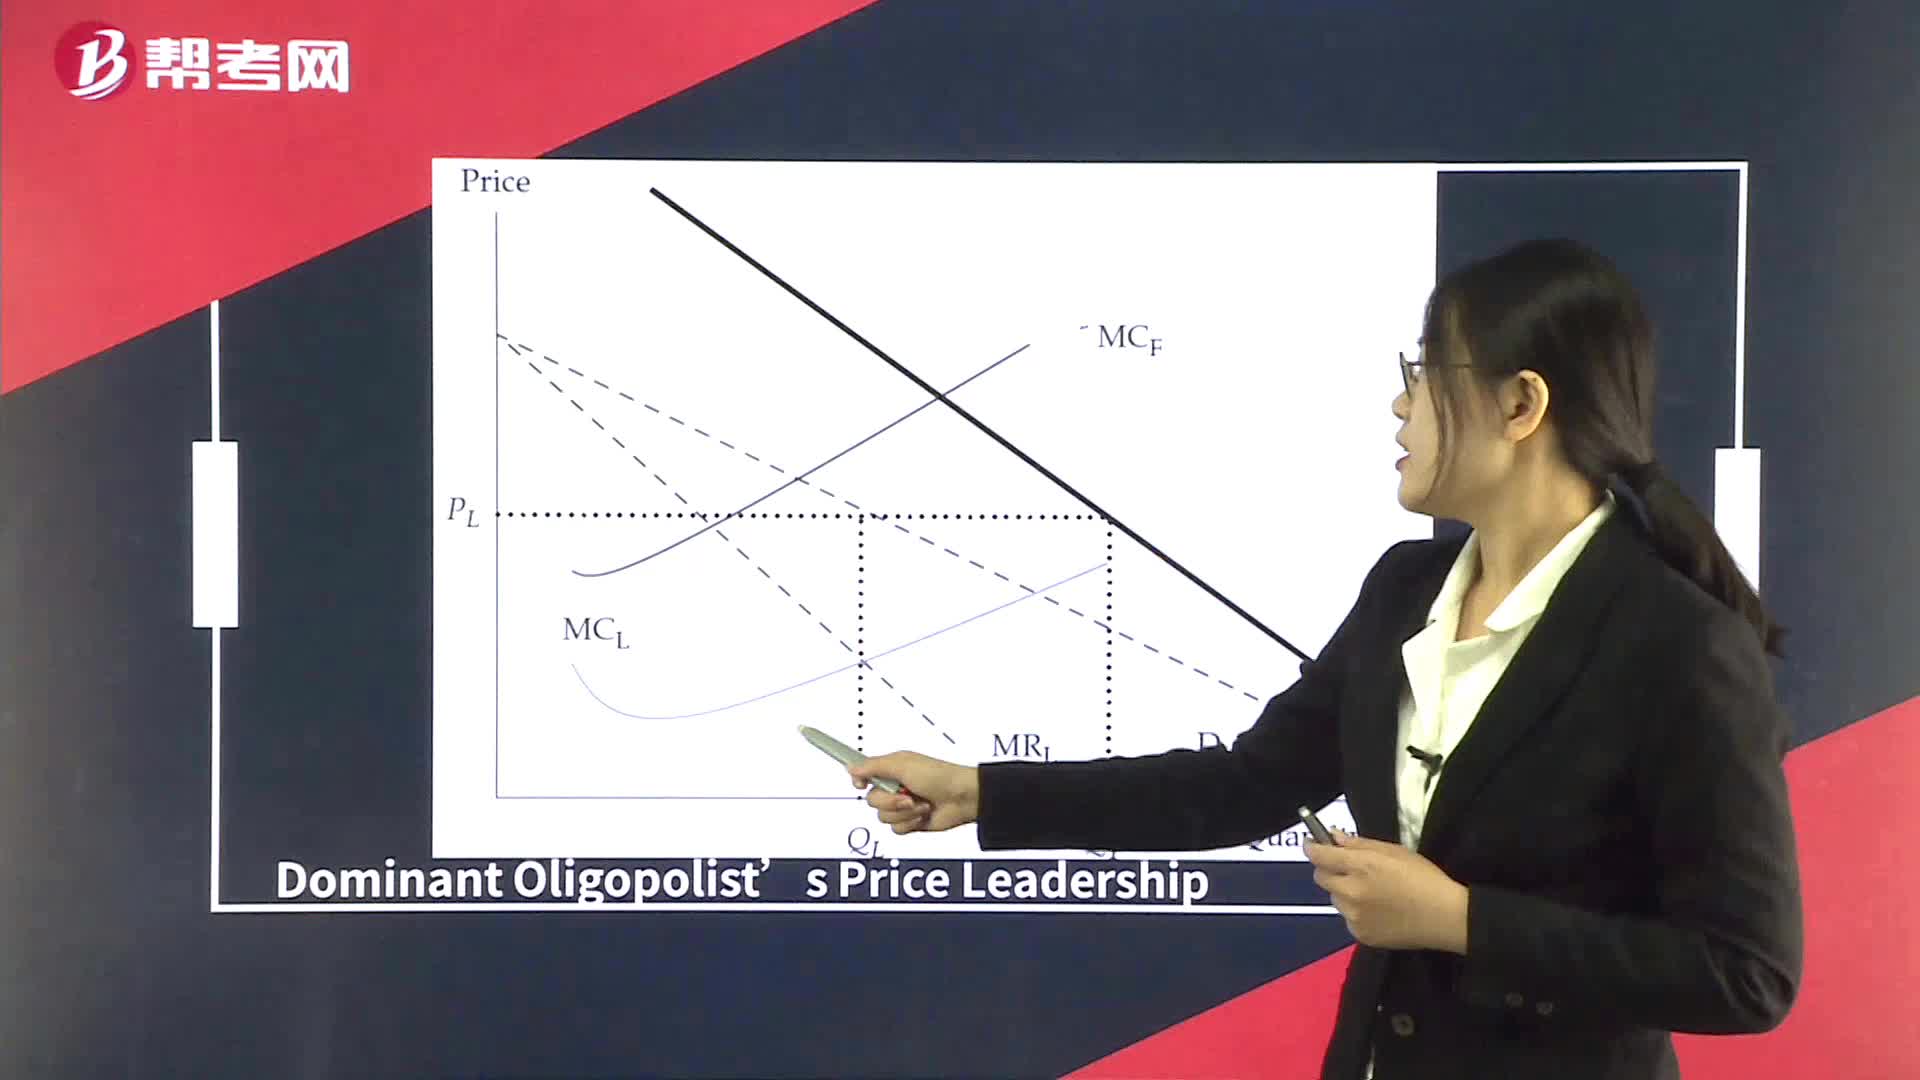
Supply Analysis in Oligopoly Market
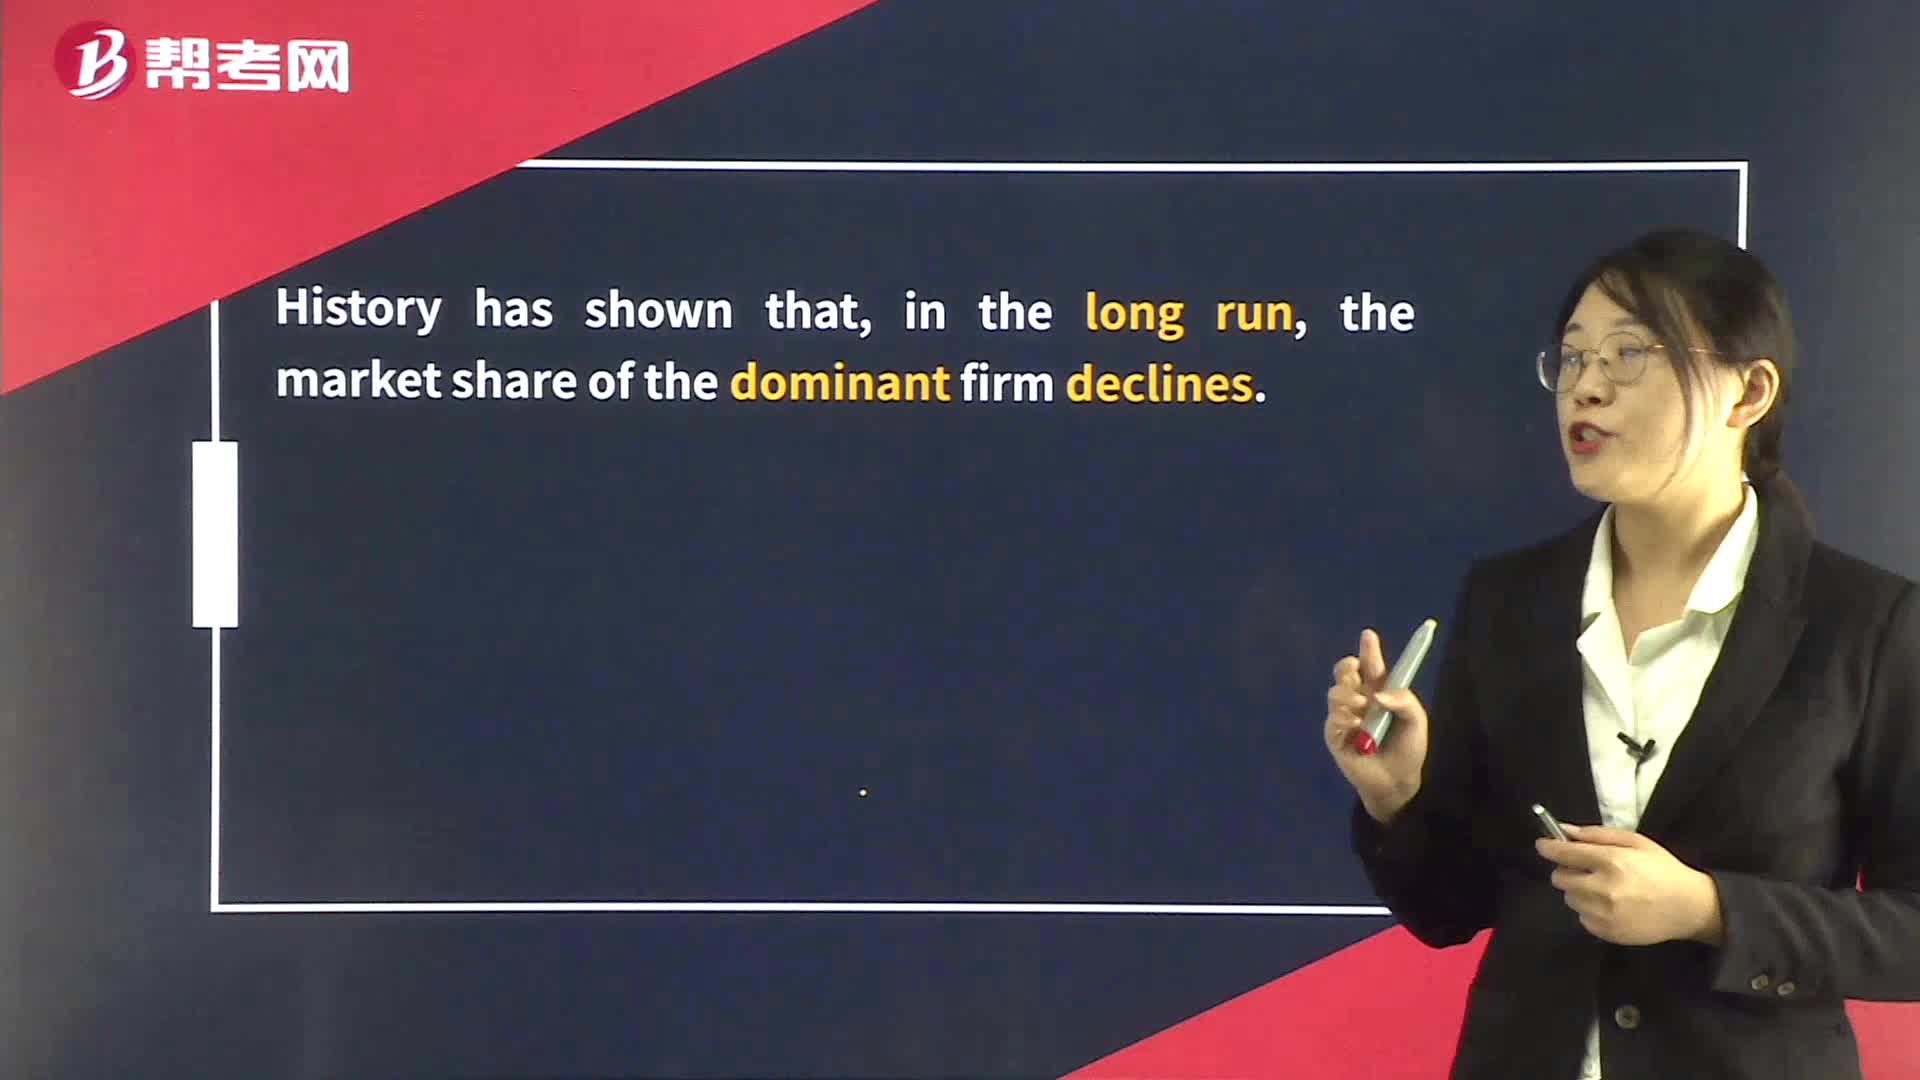
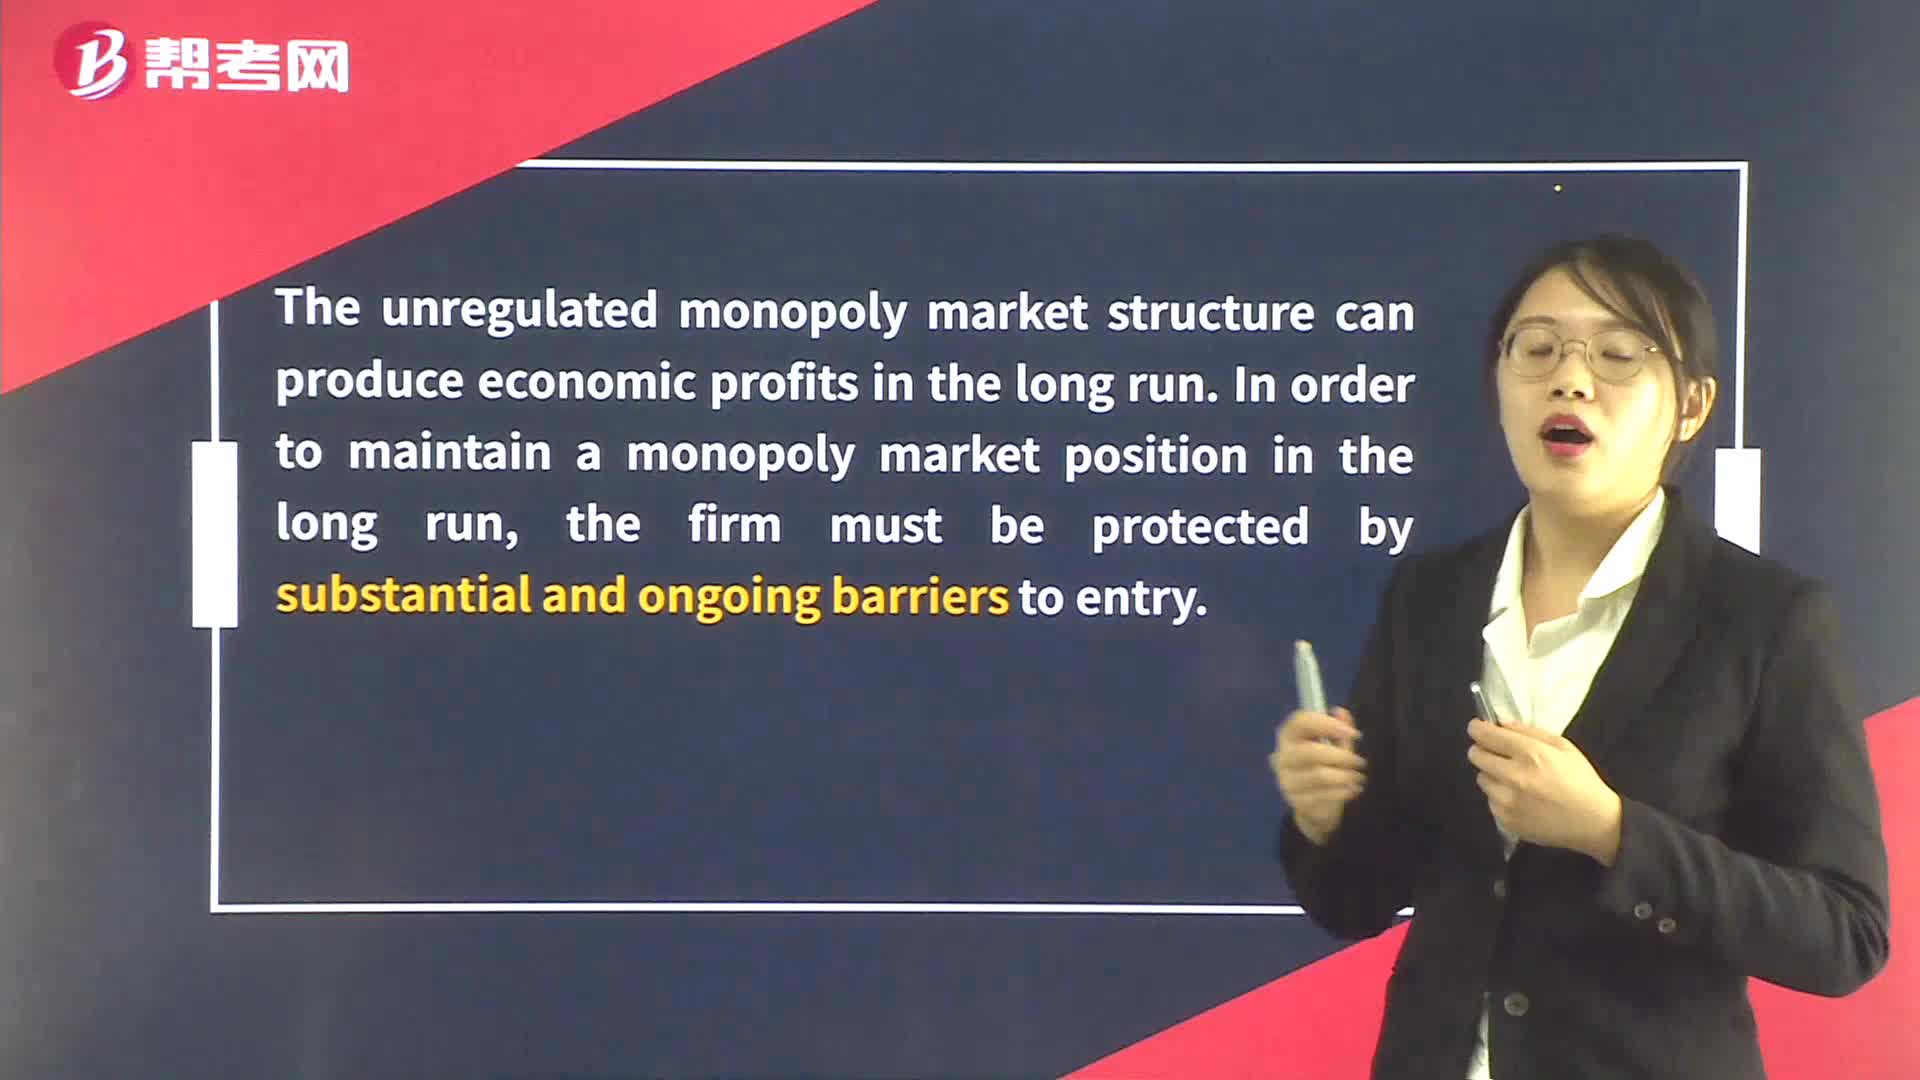
Supply Analysis in Monopoly