
CFA考試相關視頻
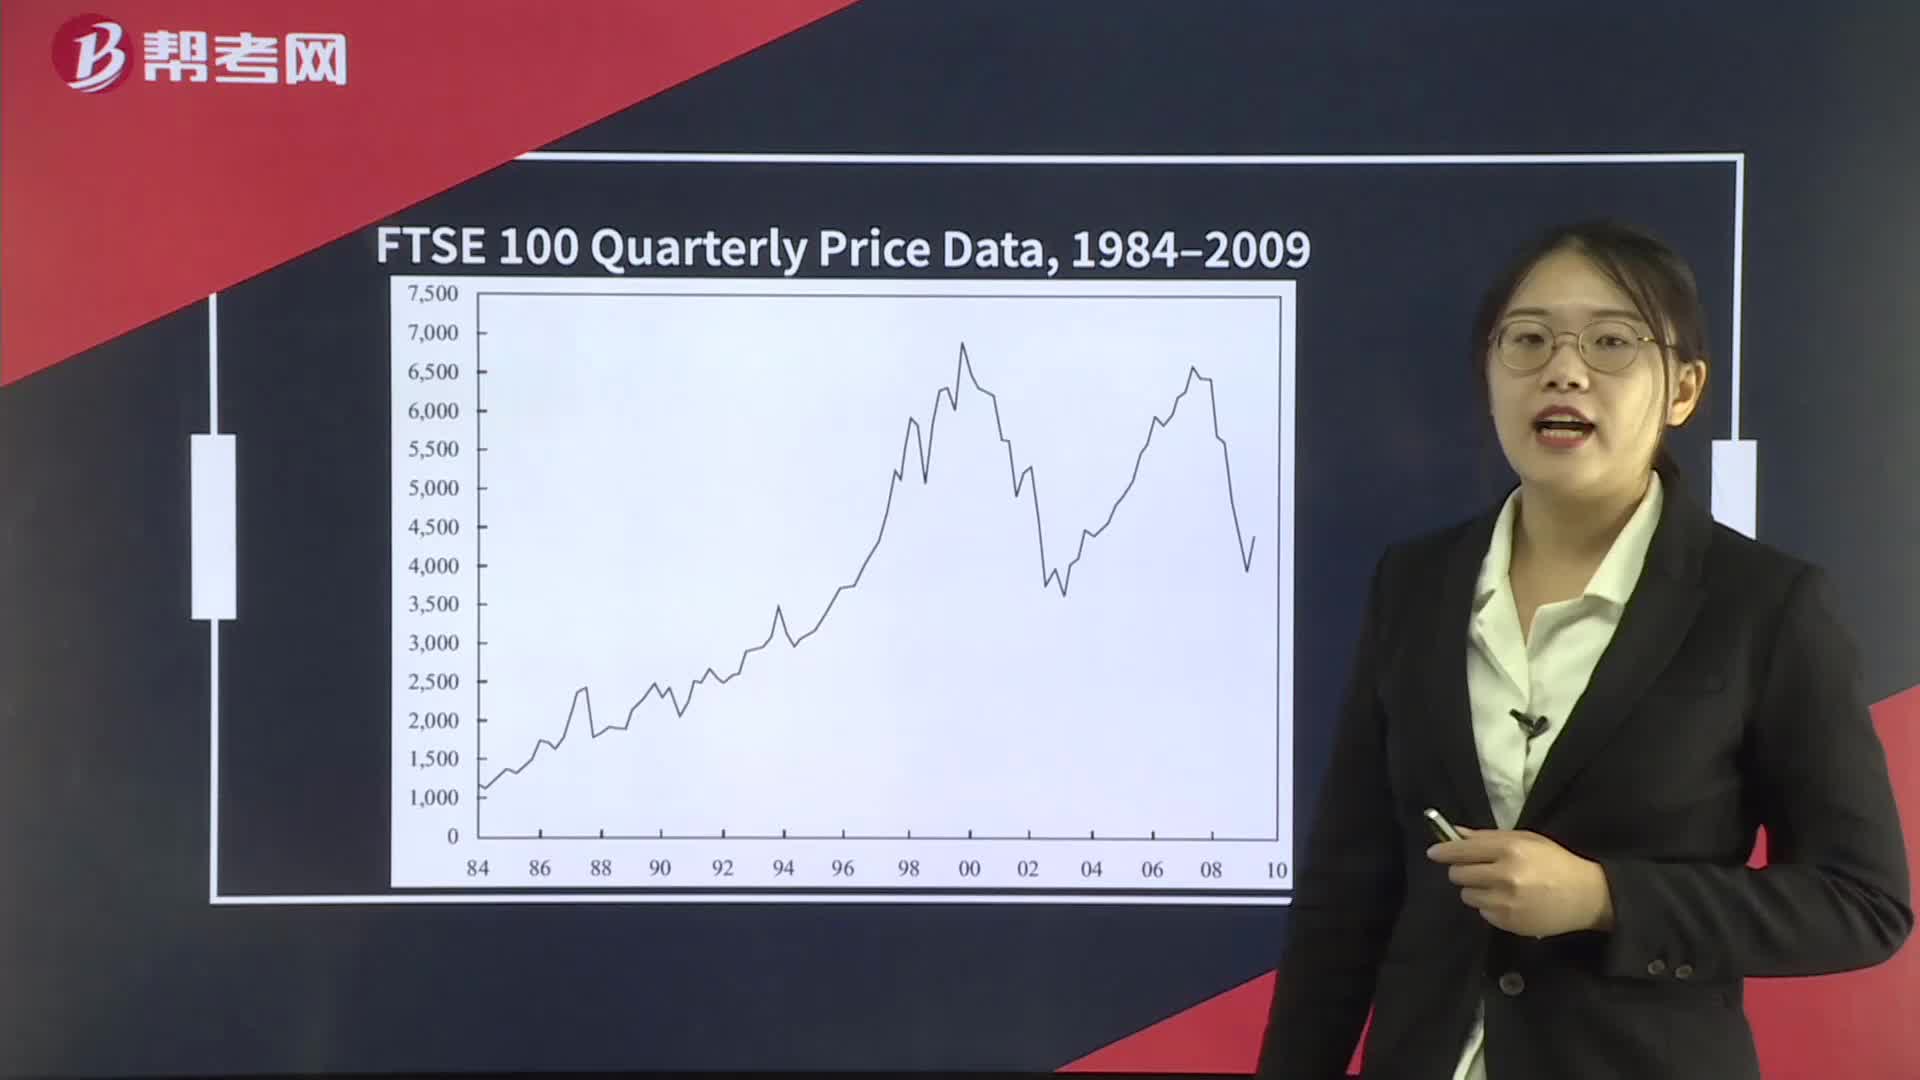
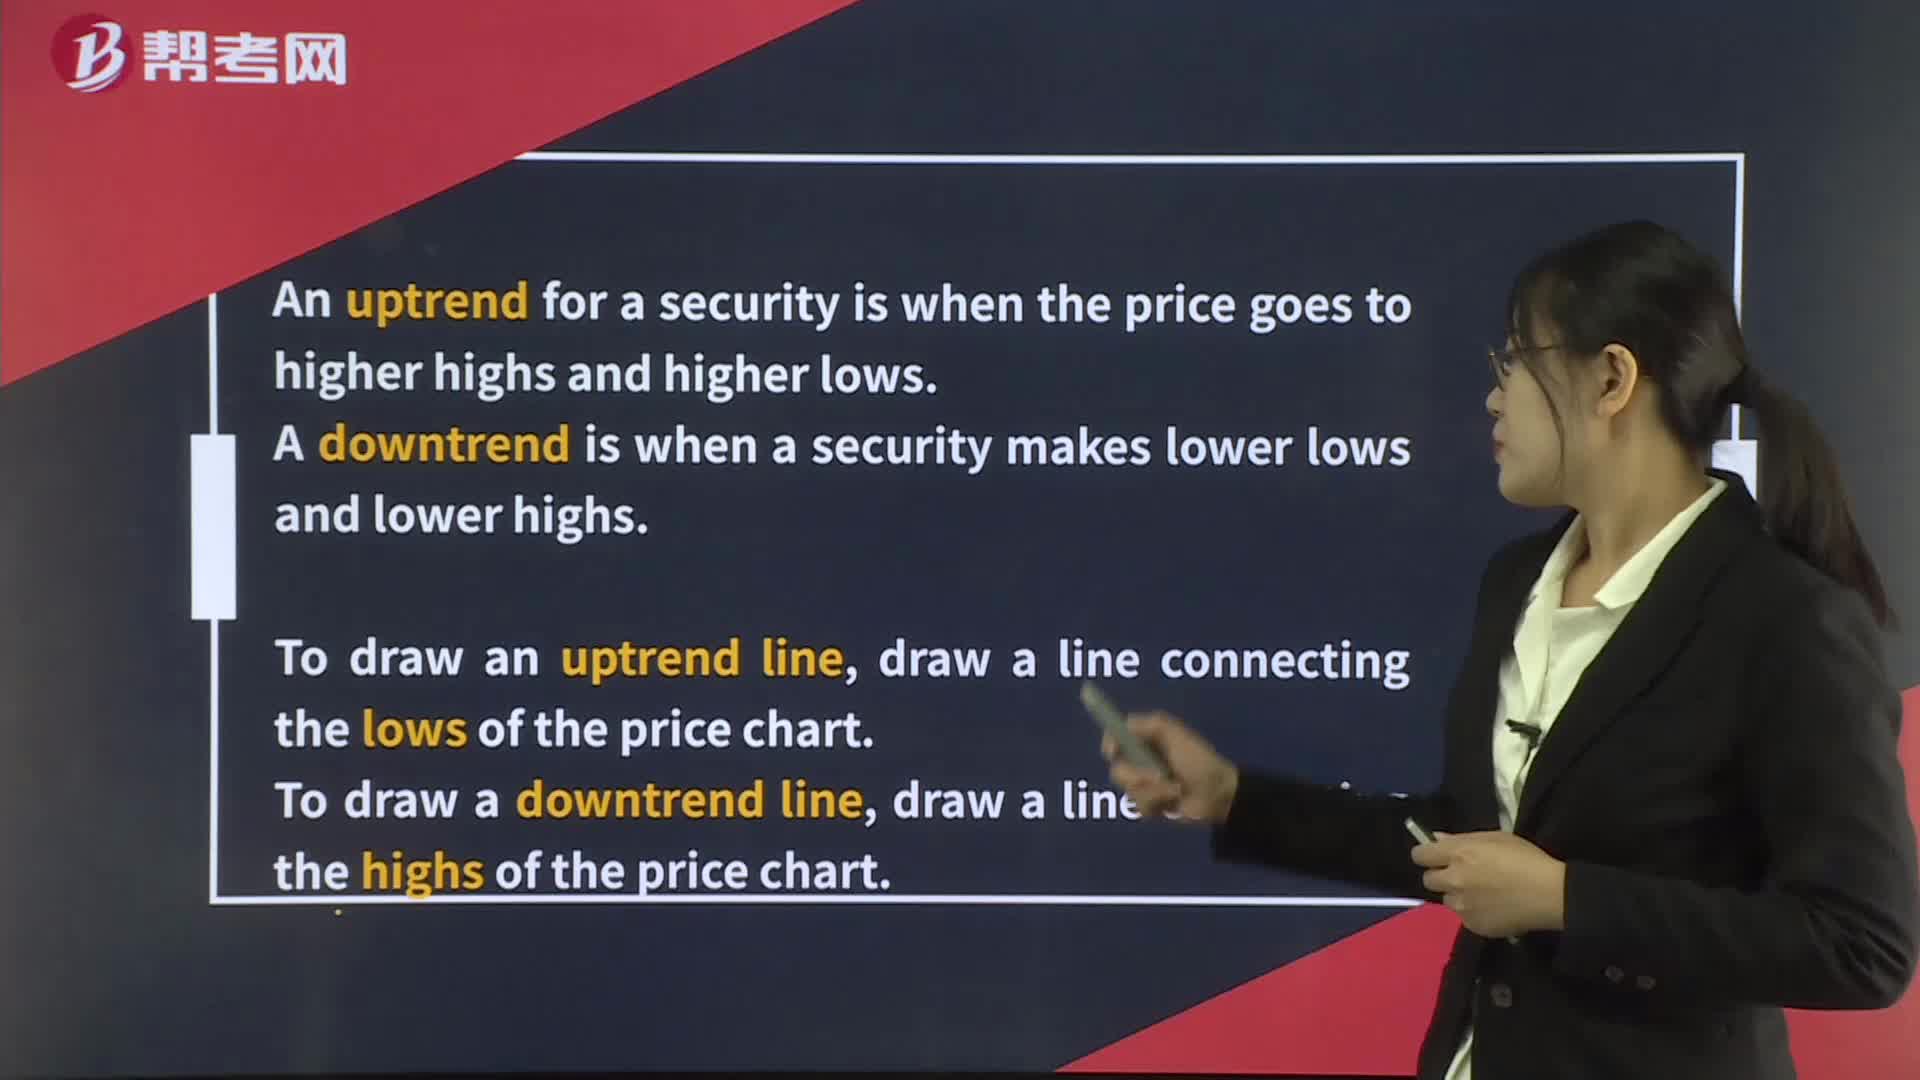
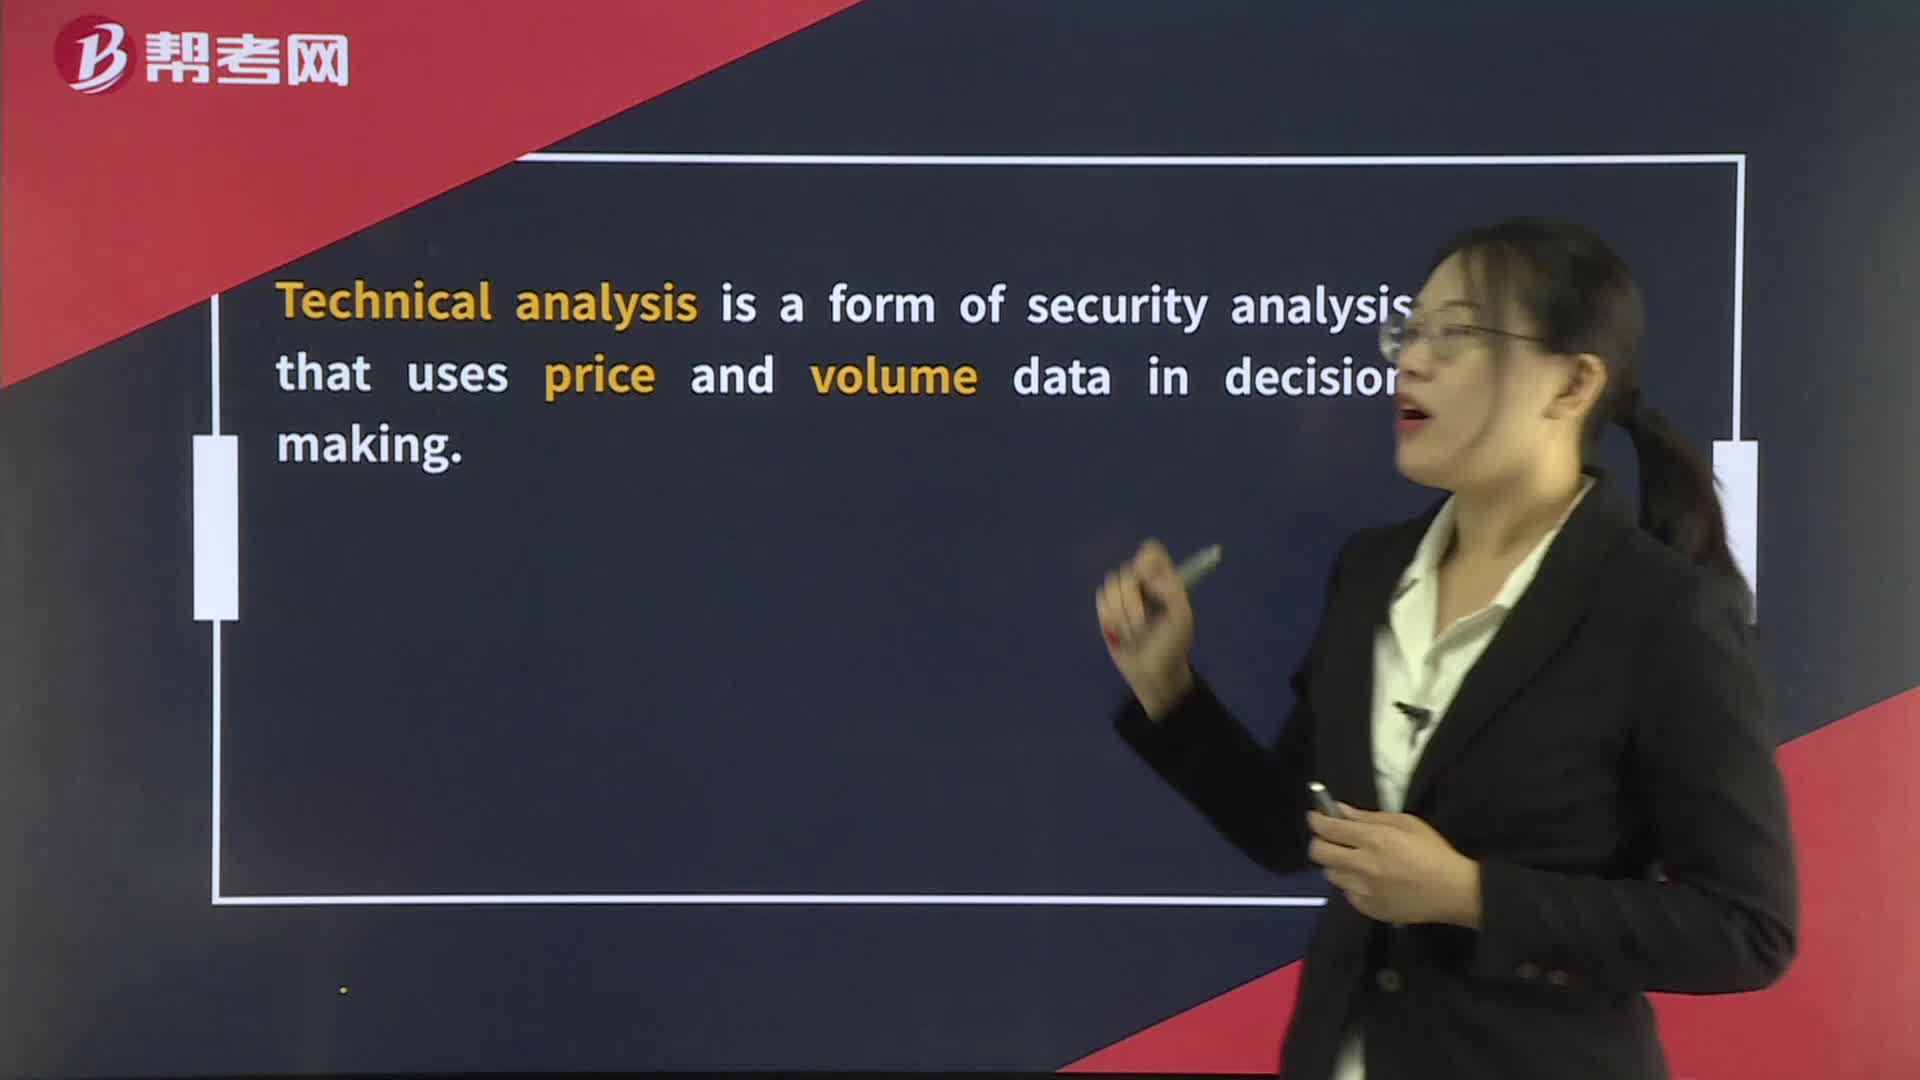
Technical Analysis Tools— Charts
Supply Analysis in Monopolistic Competition
Technical Analysis Tools— Chart Patterns
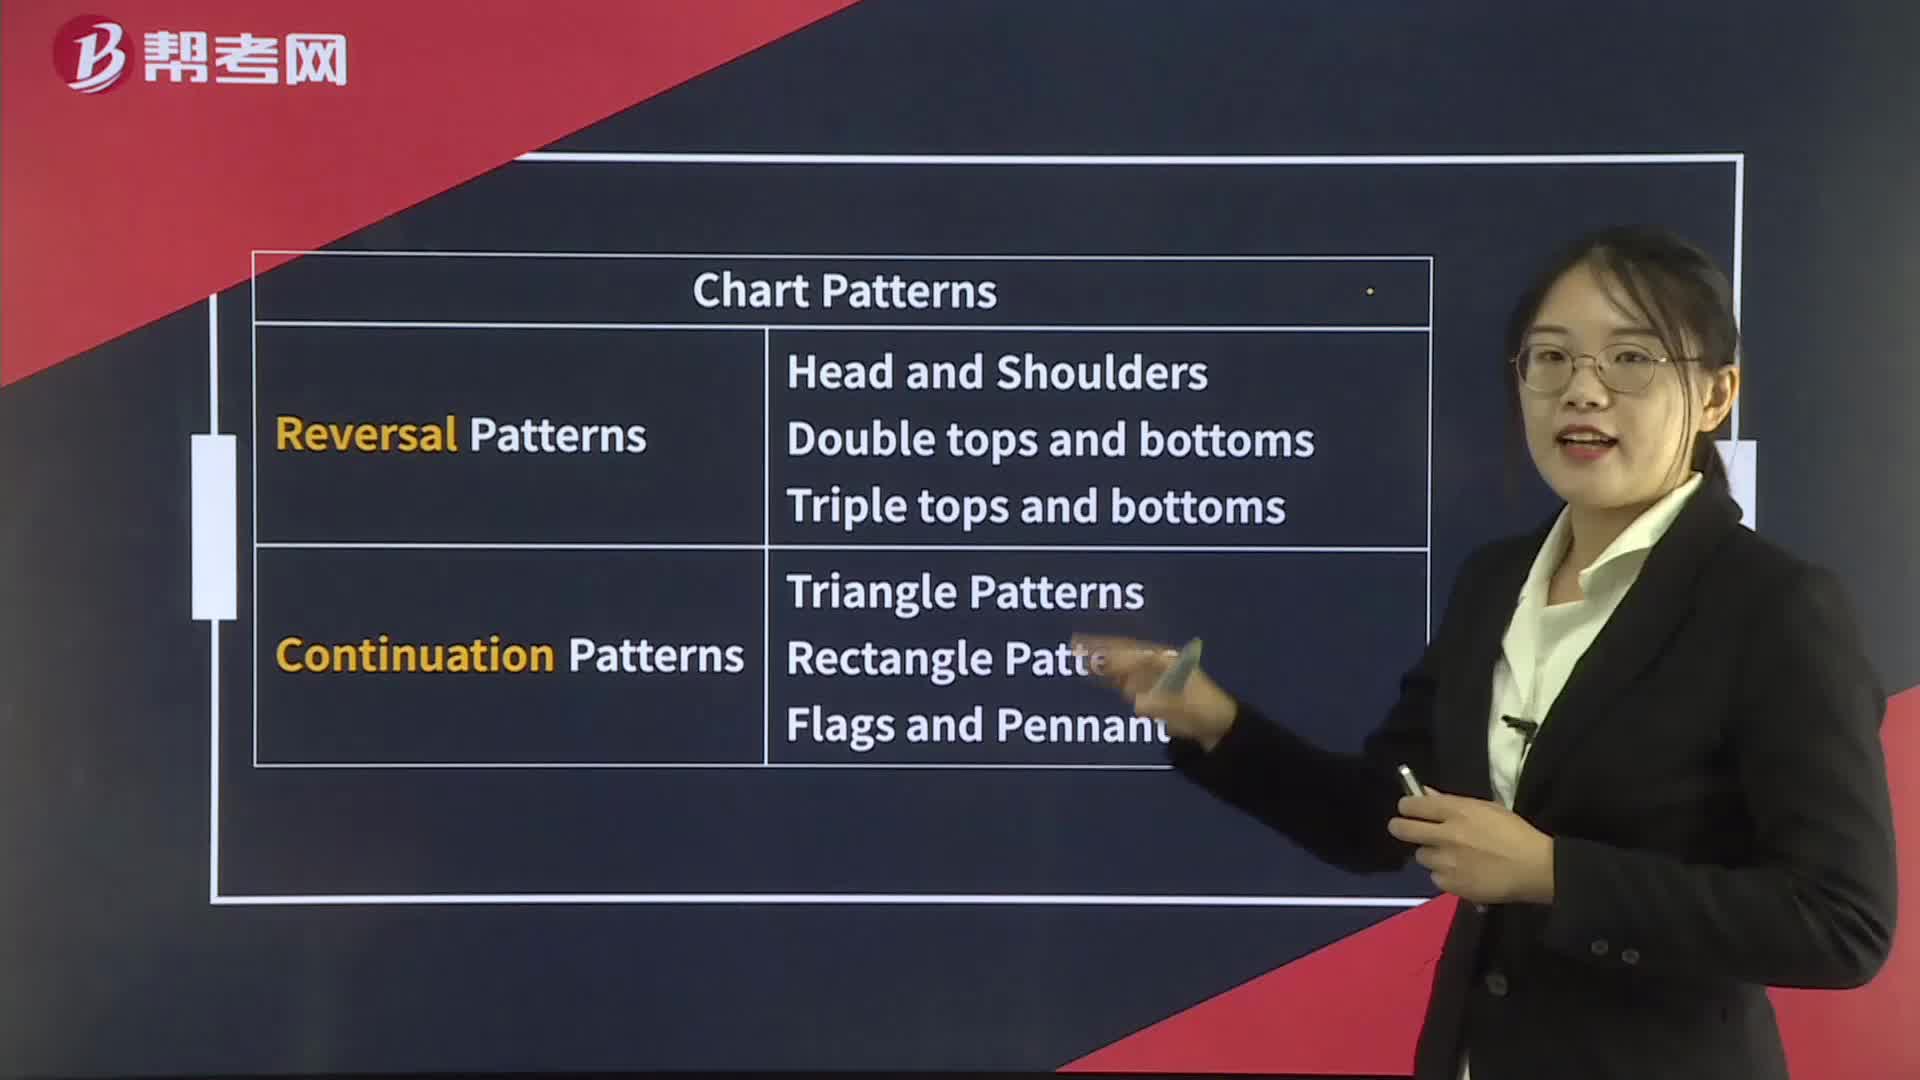
Technical Analysis Tools— Chart Patterns Summary
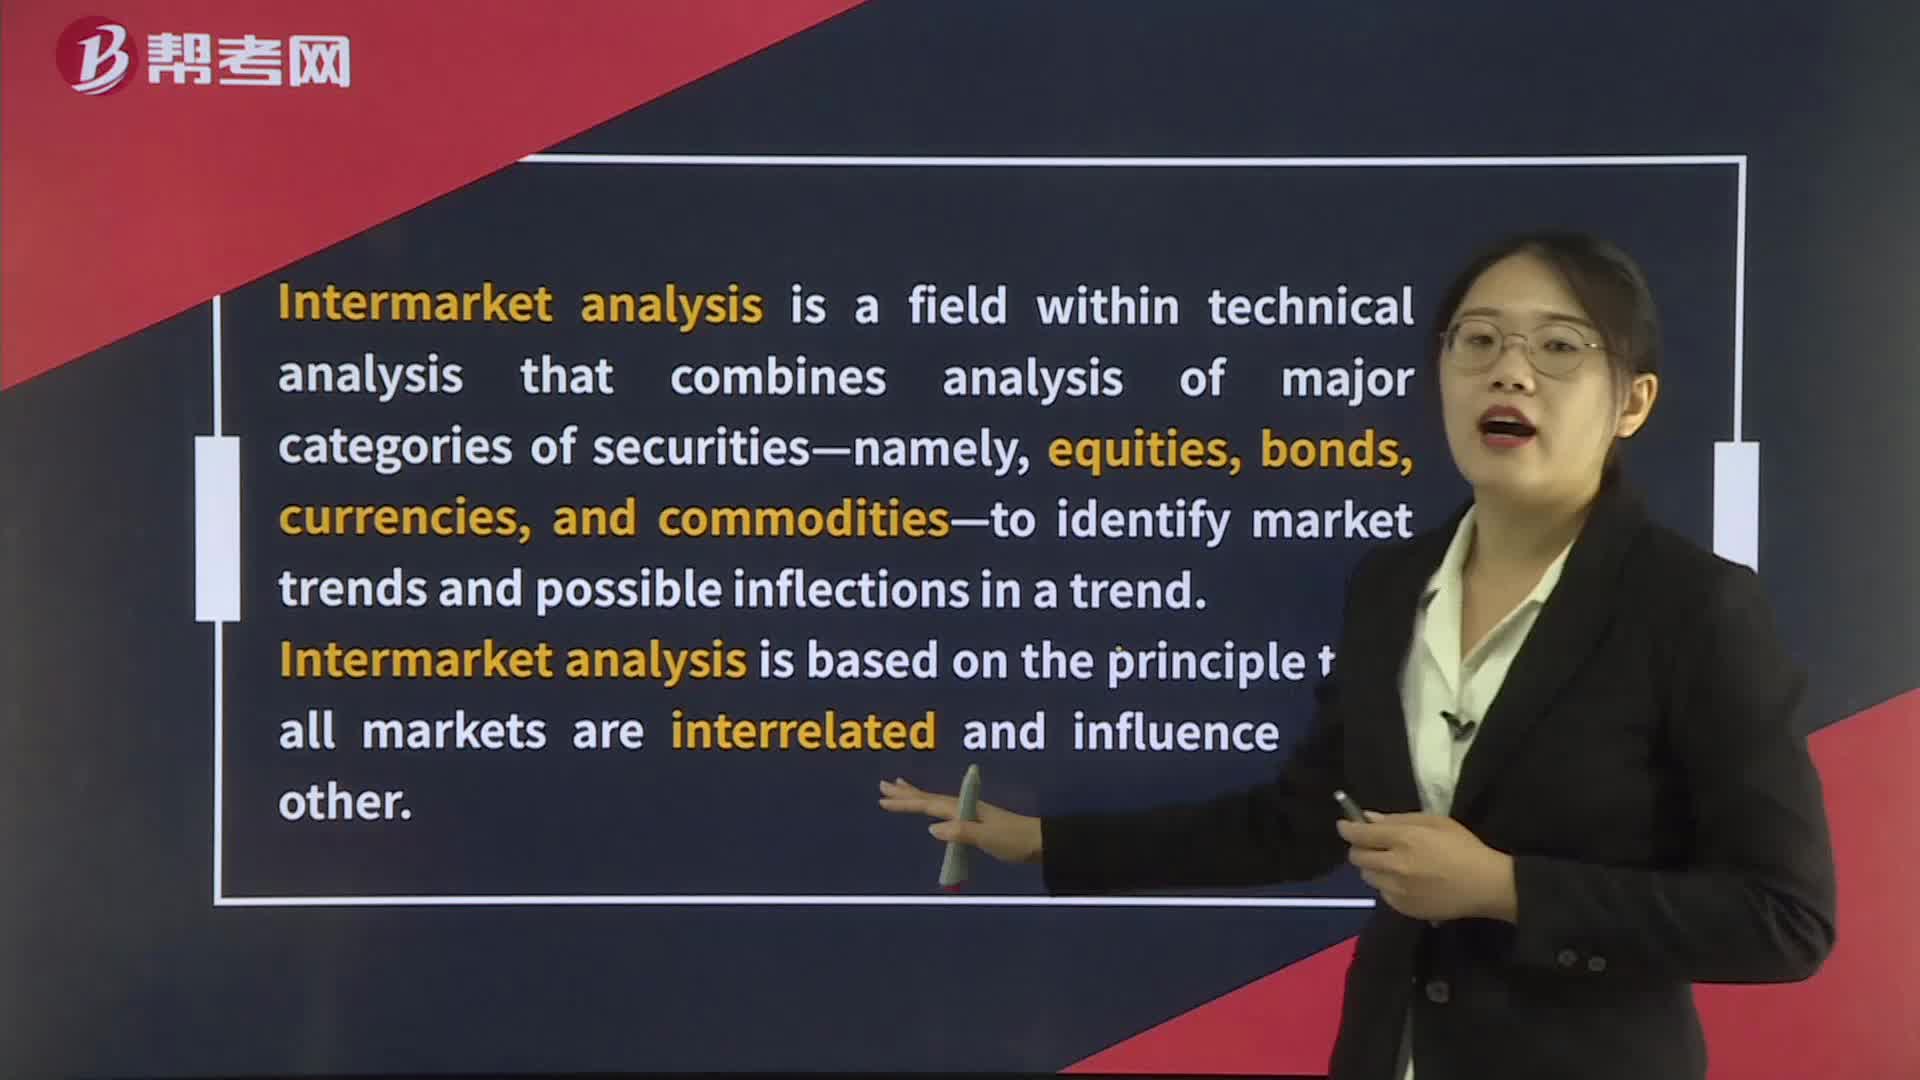
Intermarket analysis
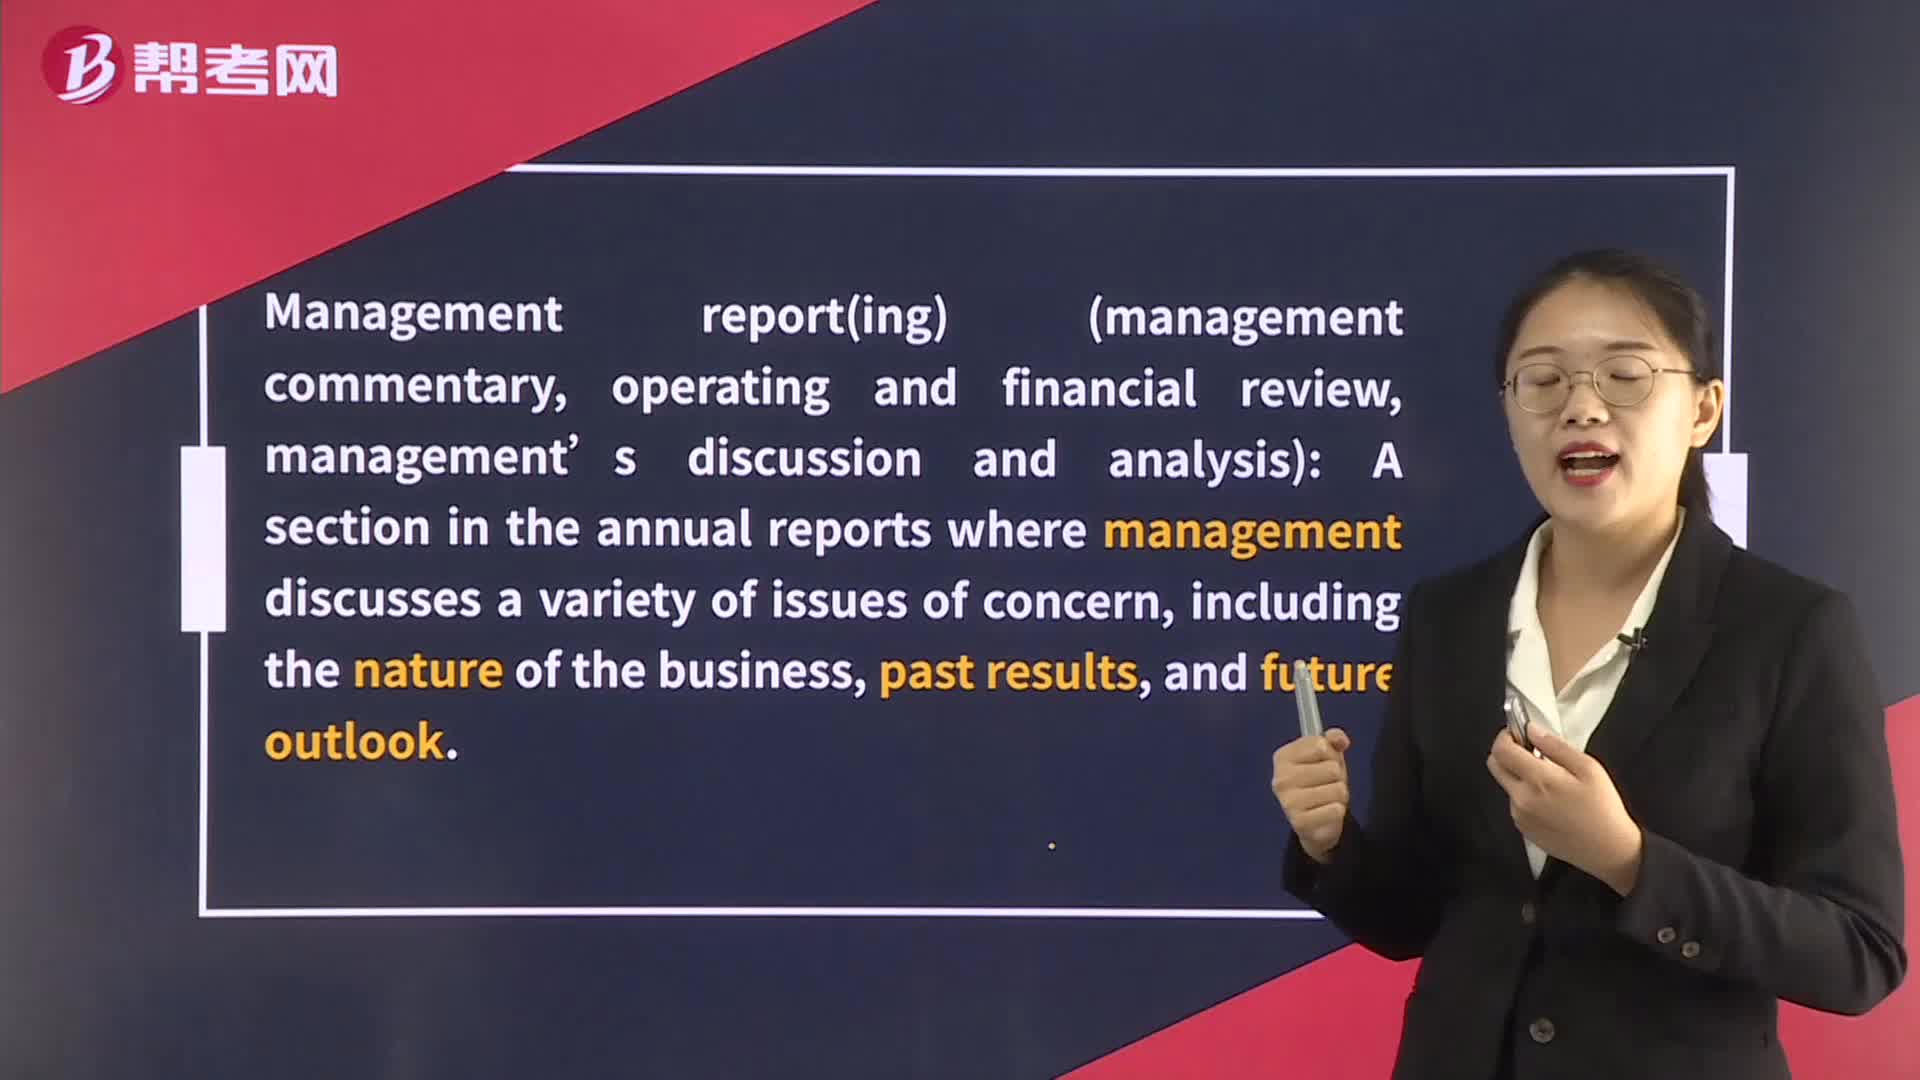
Management Commentary or Management’s Discussion and Analysis
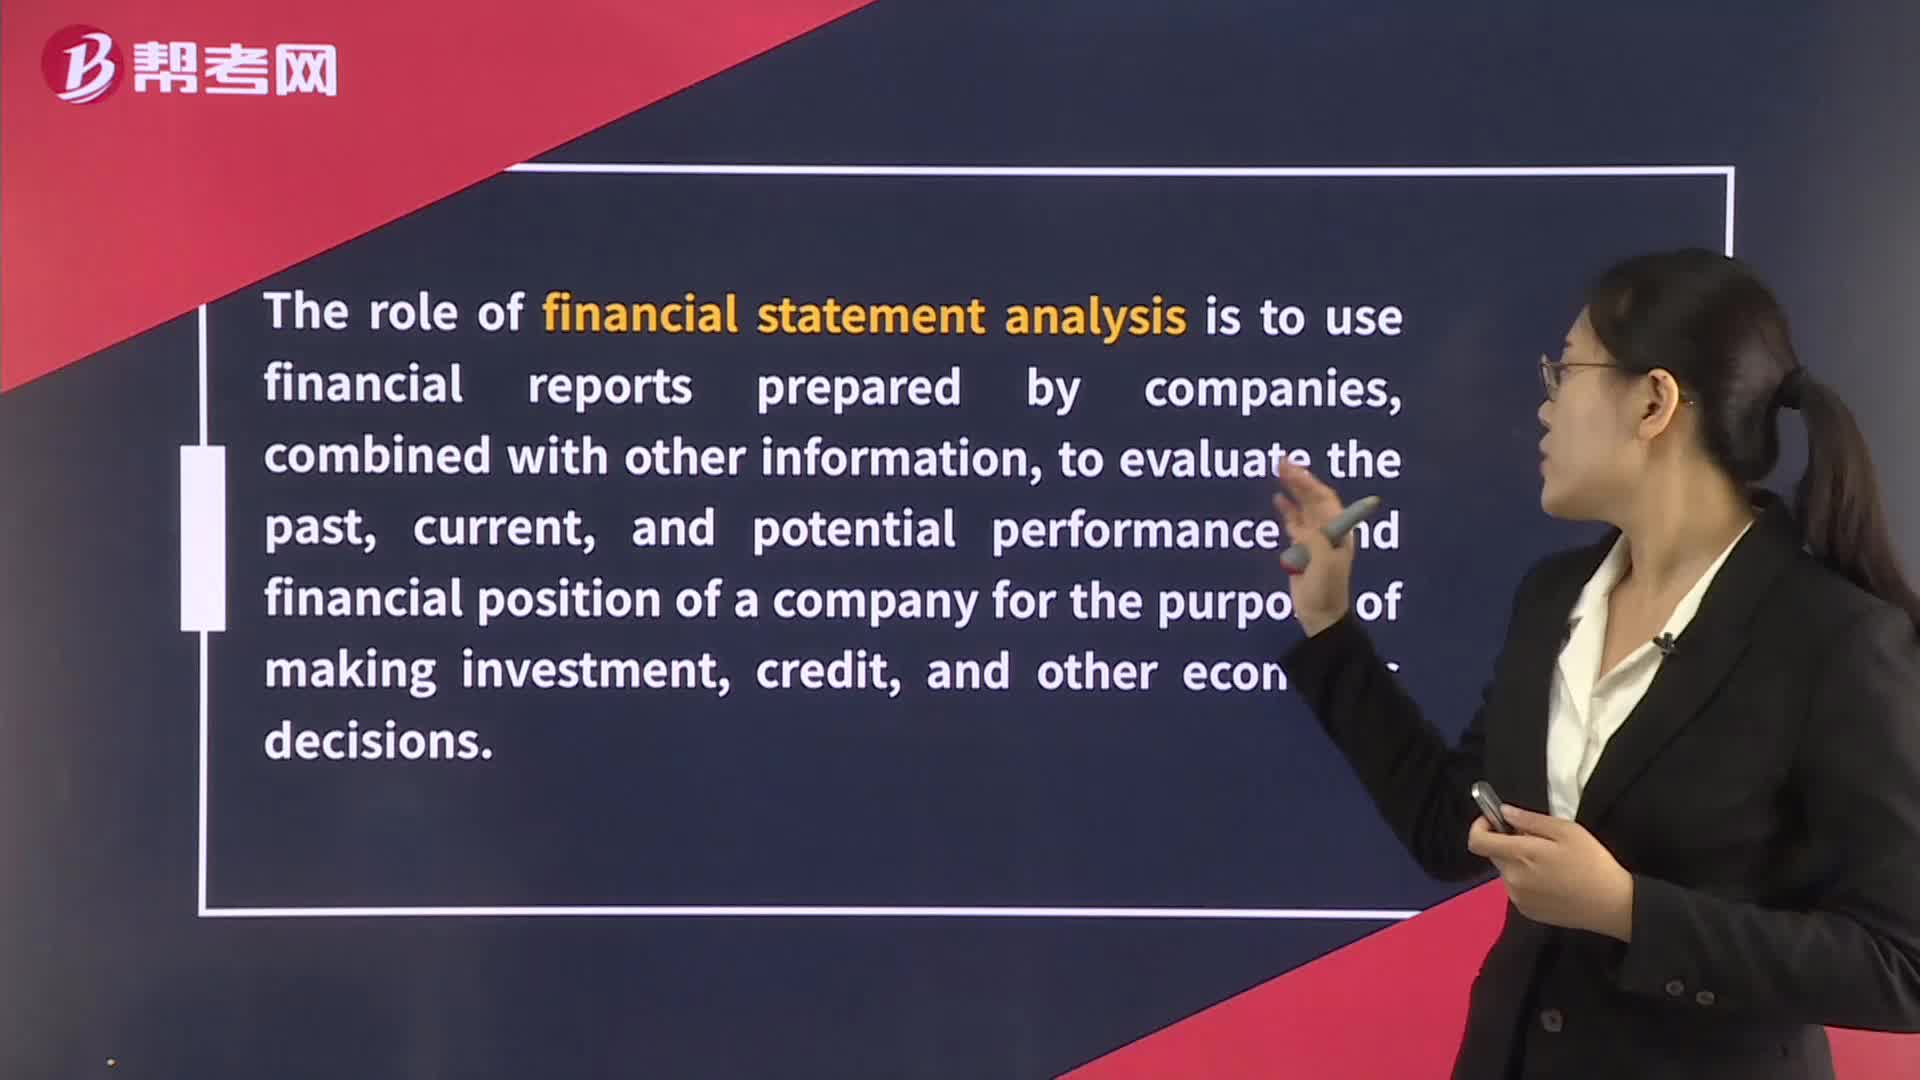
Scope of Financial Statement Analysis
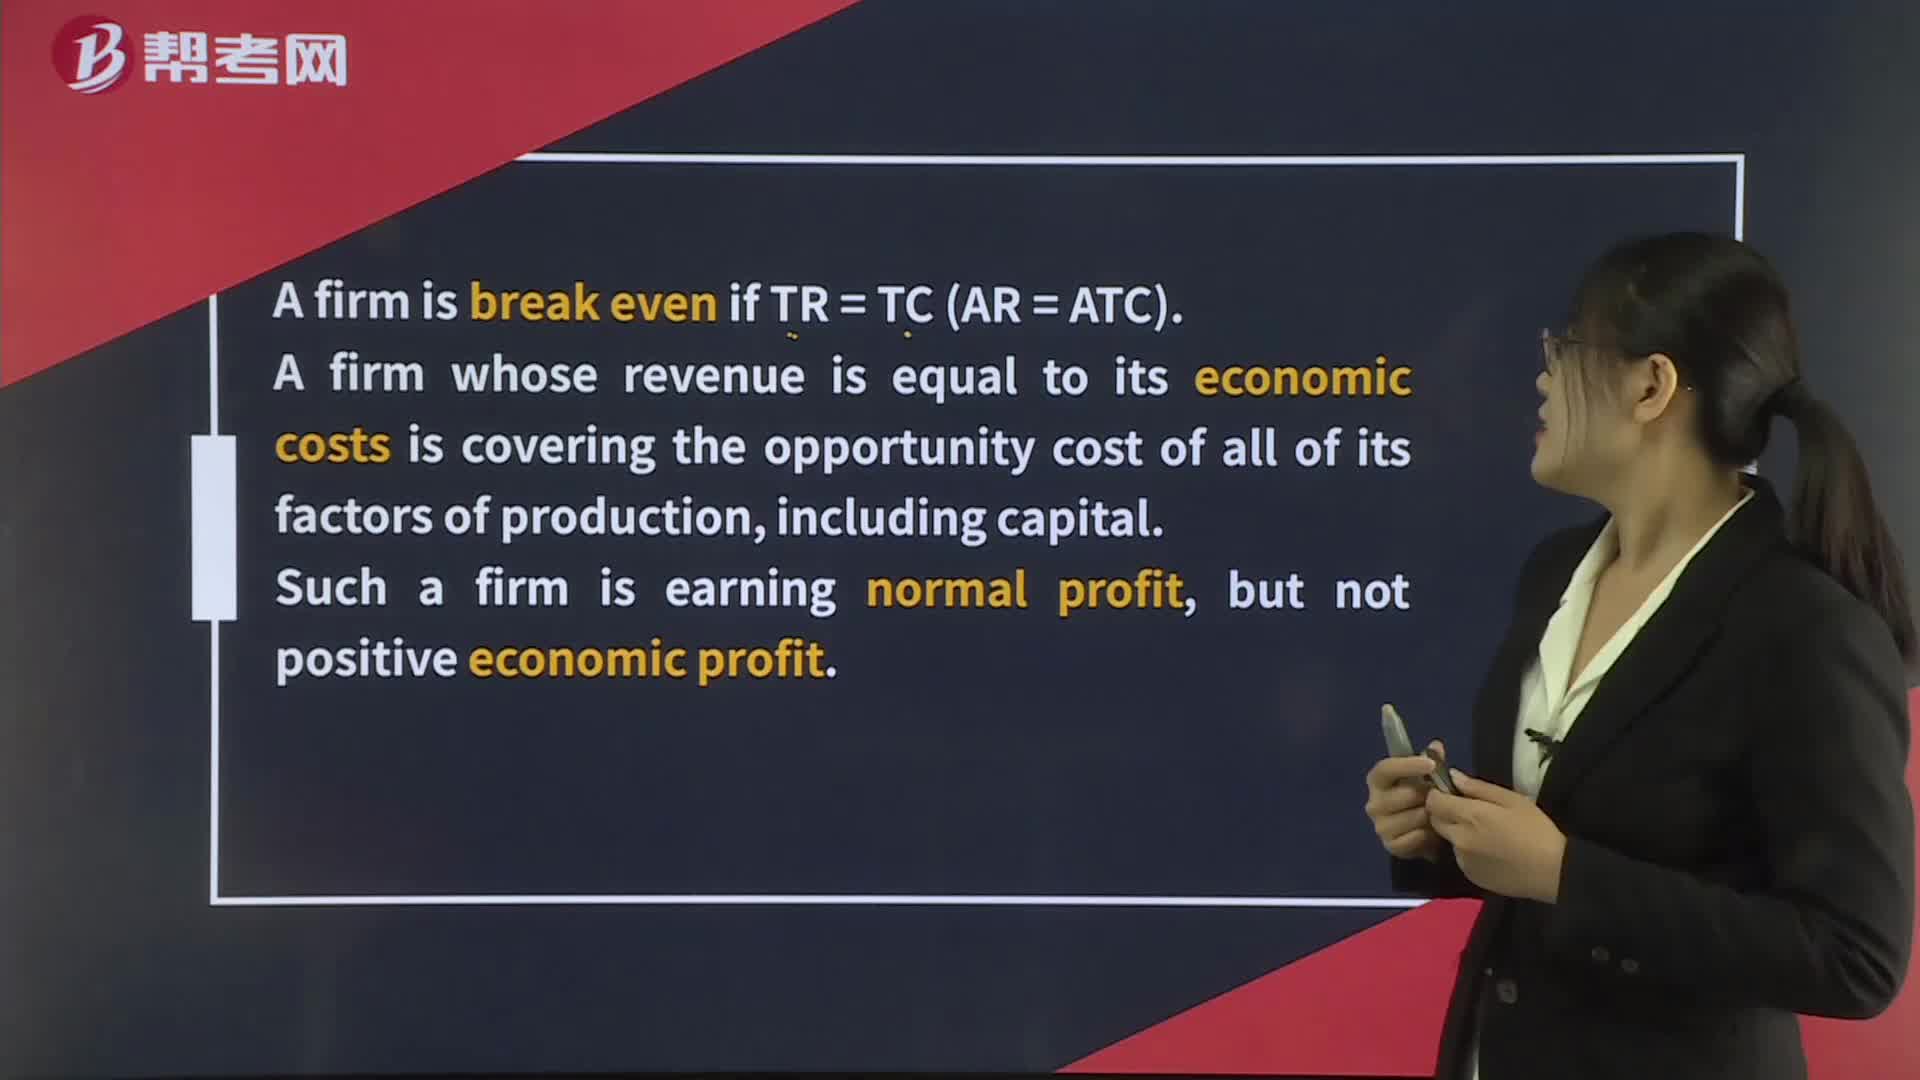
Breakeven Analysis
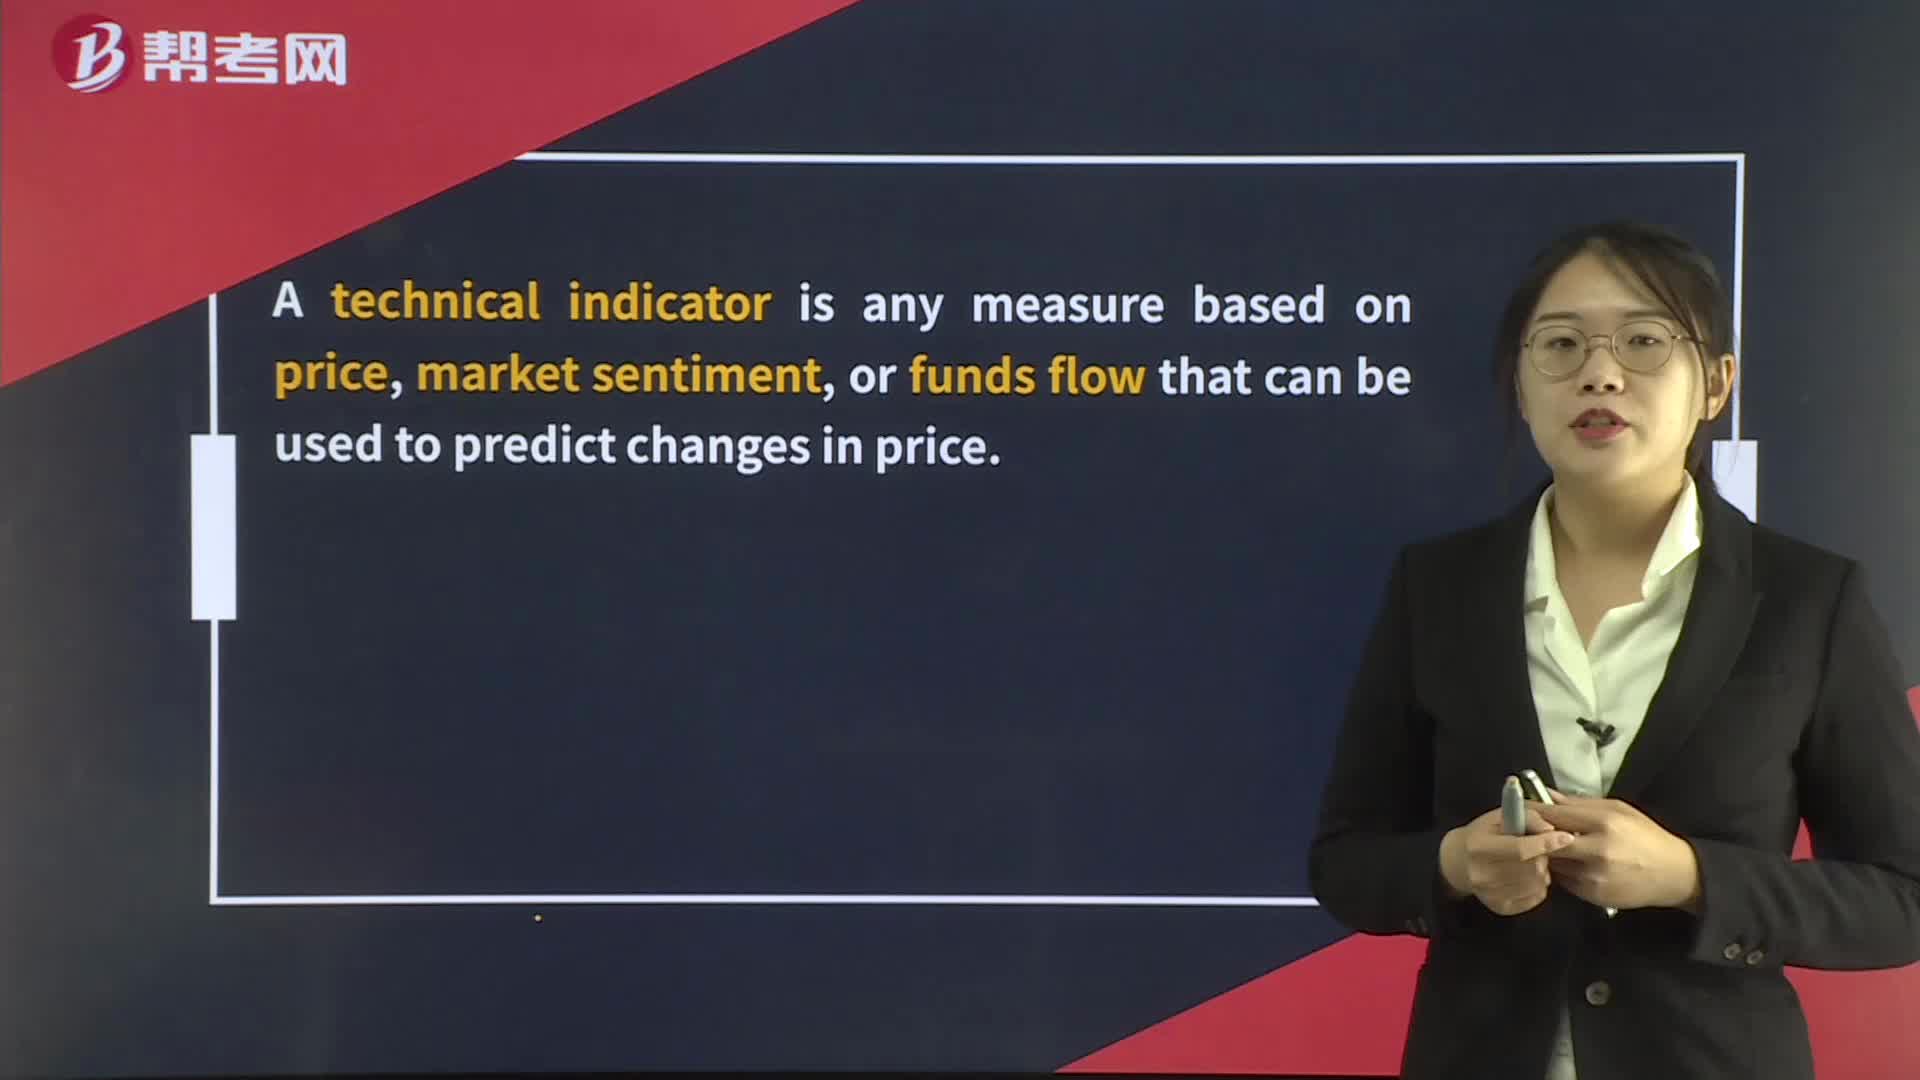
Technical Analysis Tools— Technical Indicators

Demand Analysis in Perfect Competition
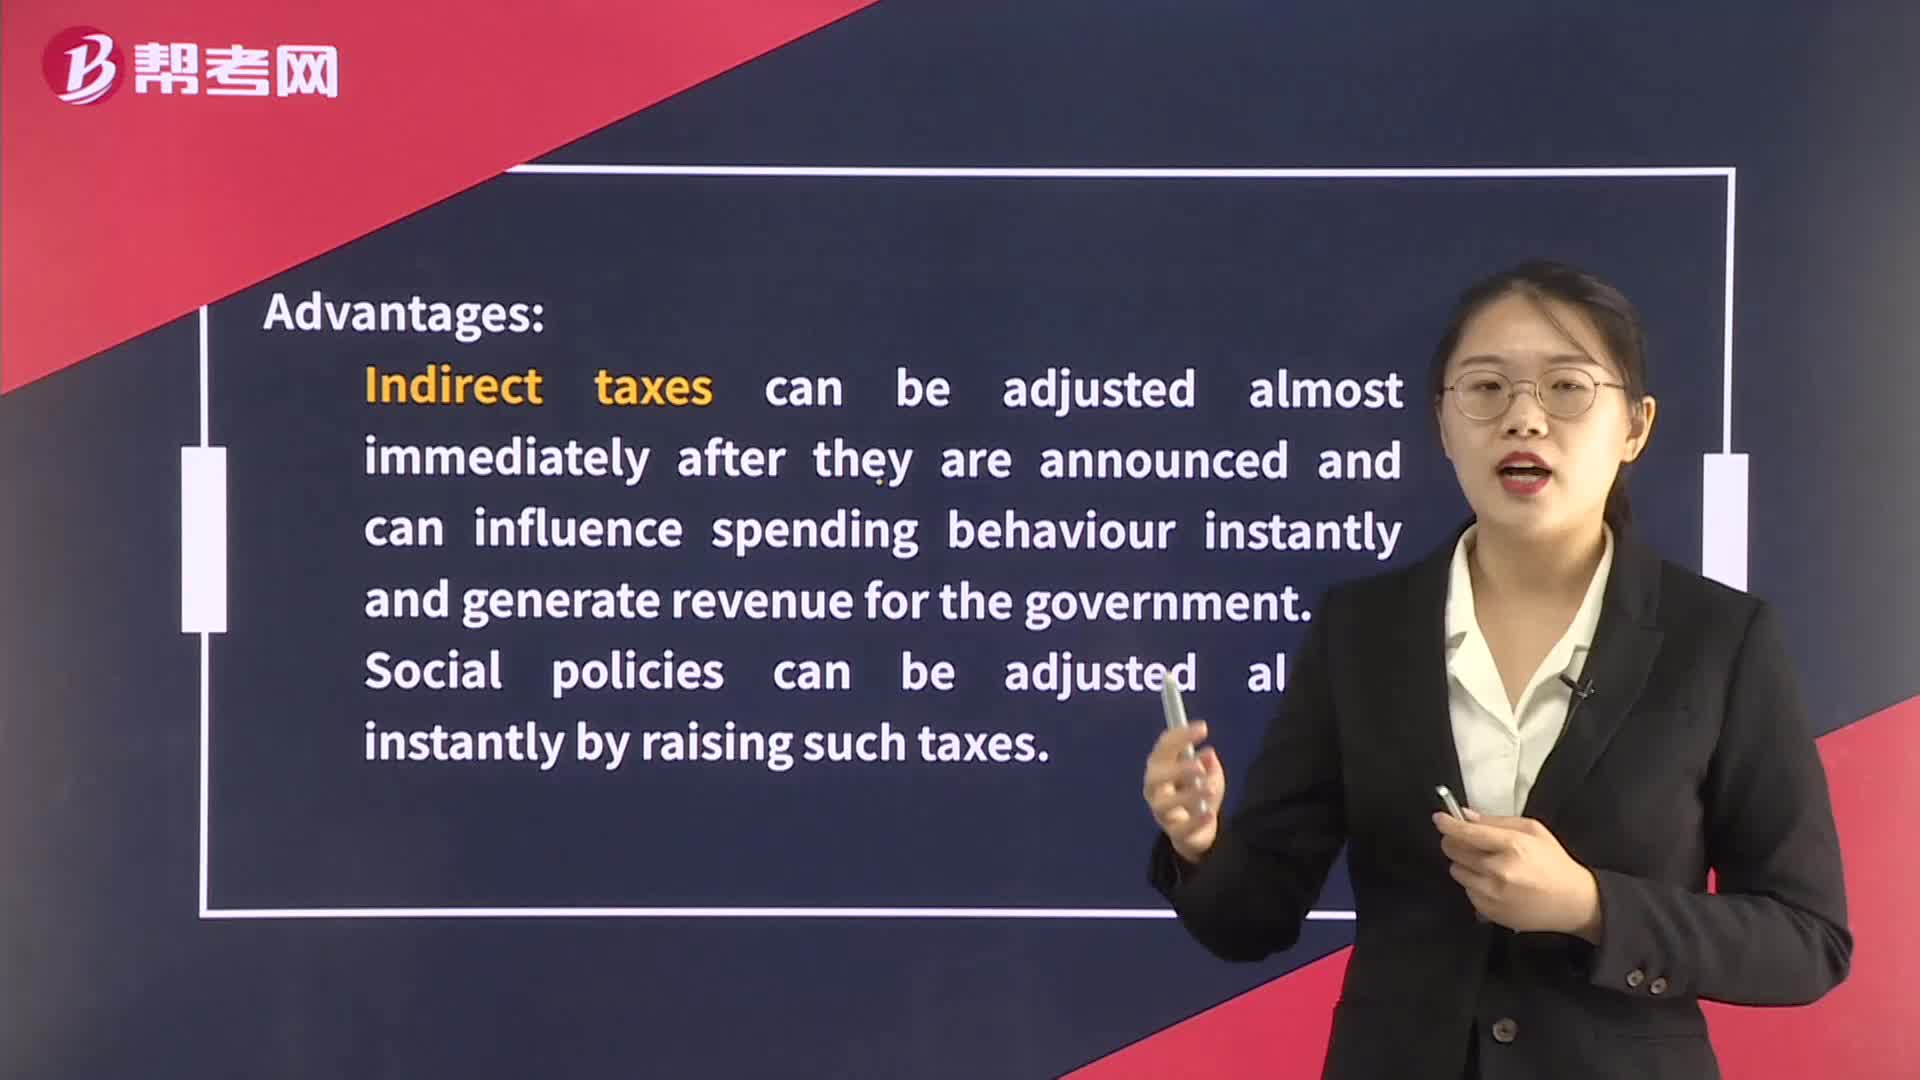
The Advantages and Disadvantages of Using the Different Tools of Fiscal Policy
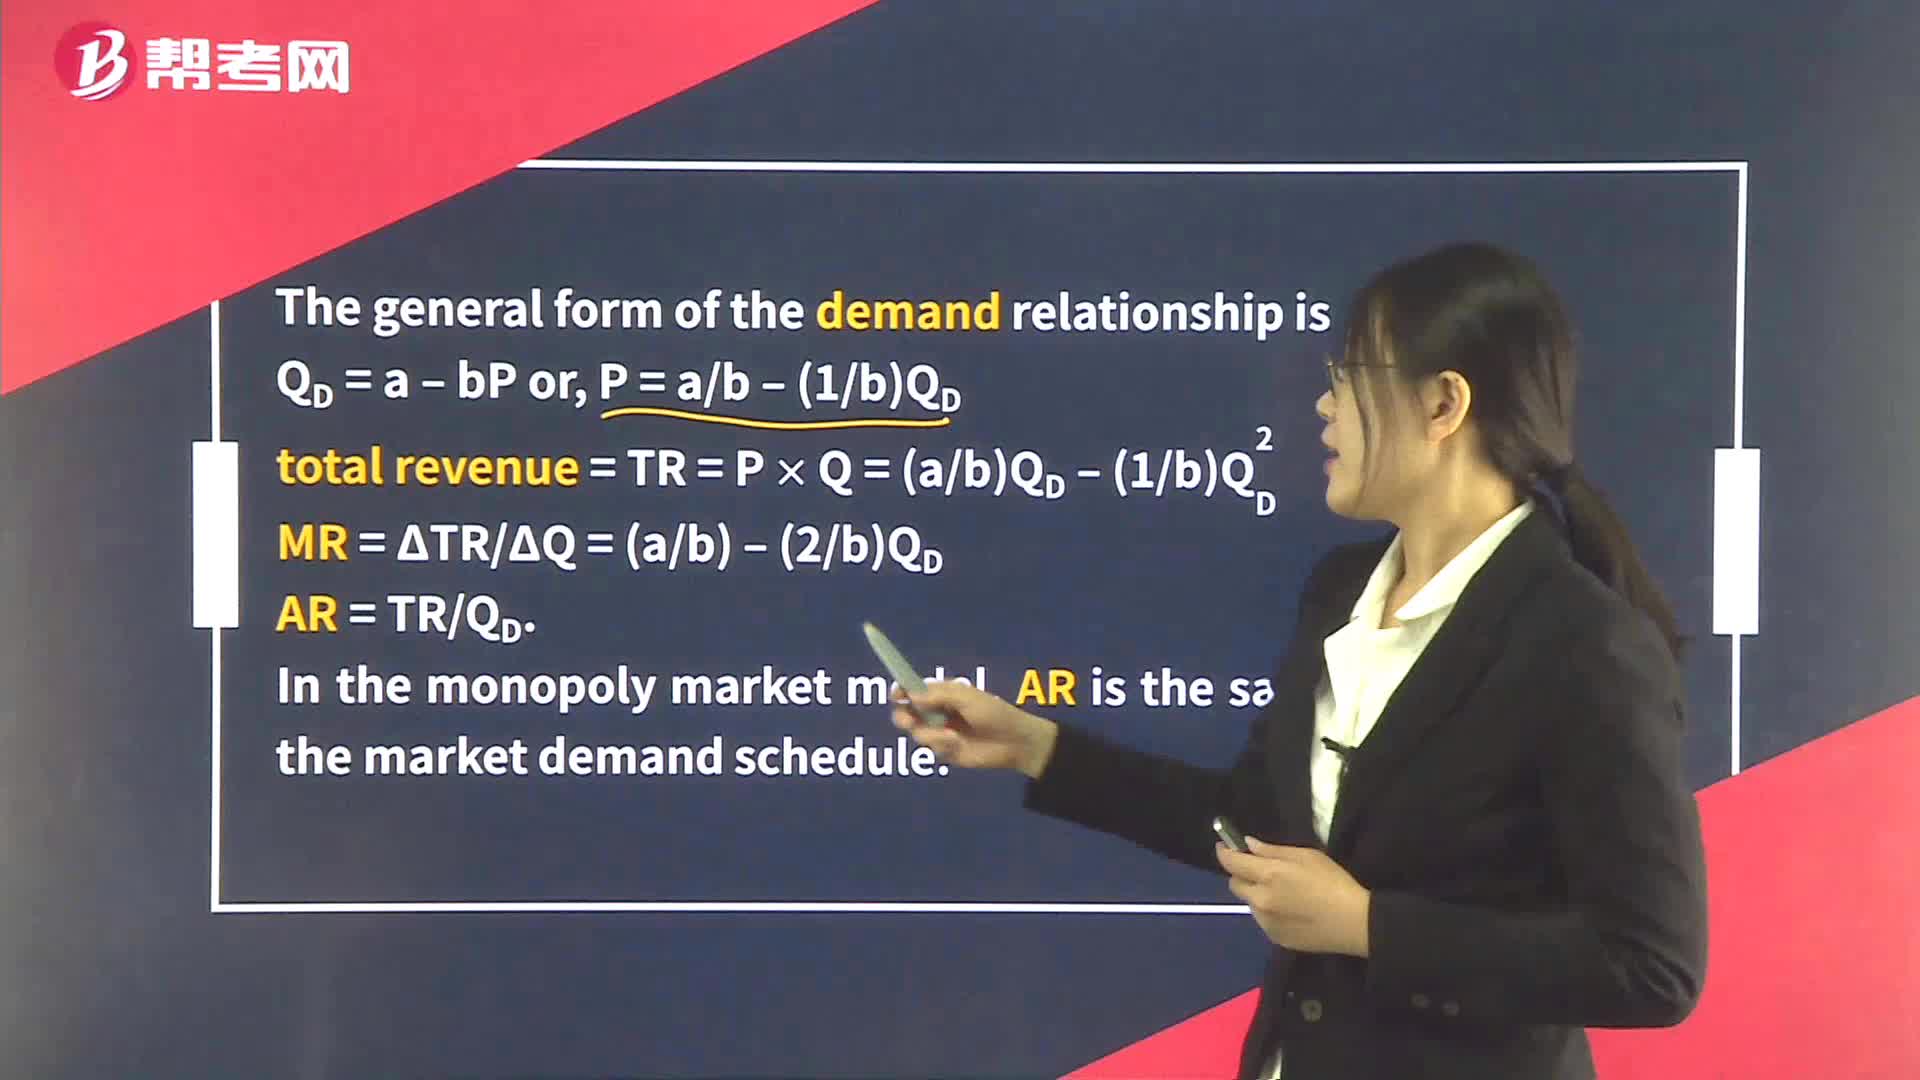
Demand Analysis in Monopoly