Technical Analysis Tools— Trend
幫考網(wǎng)校2020-08-05 14:37:59
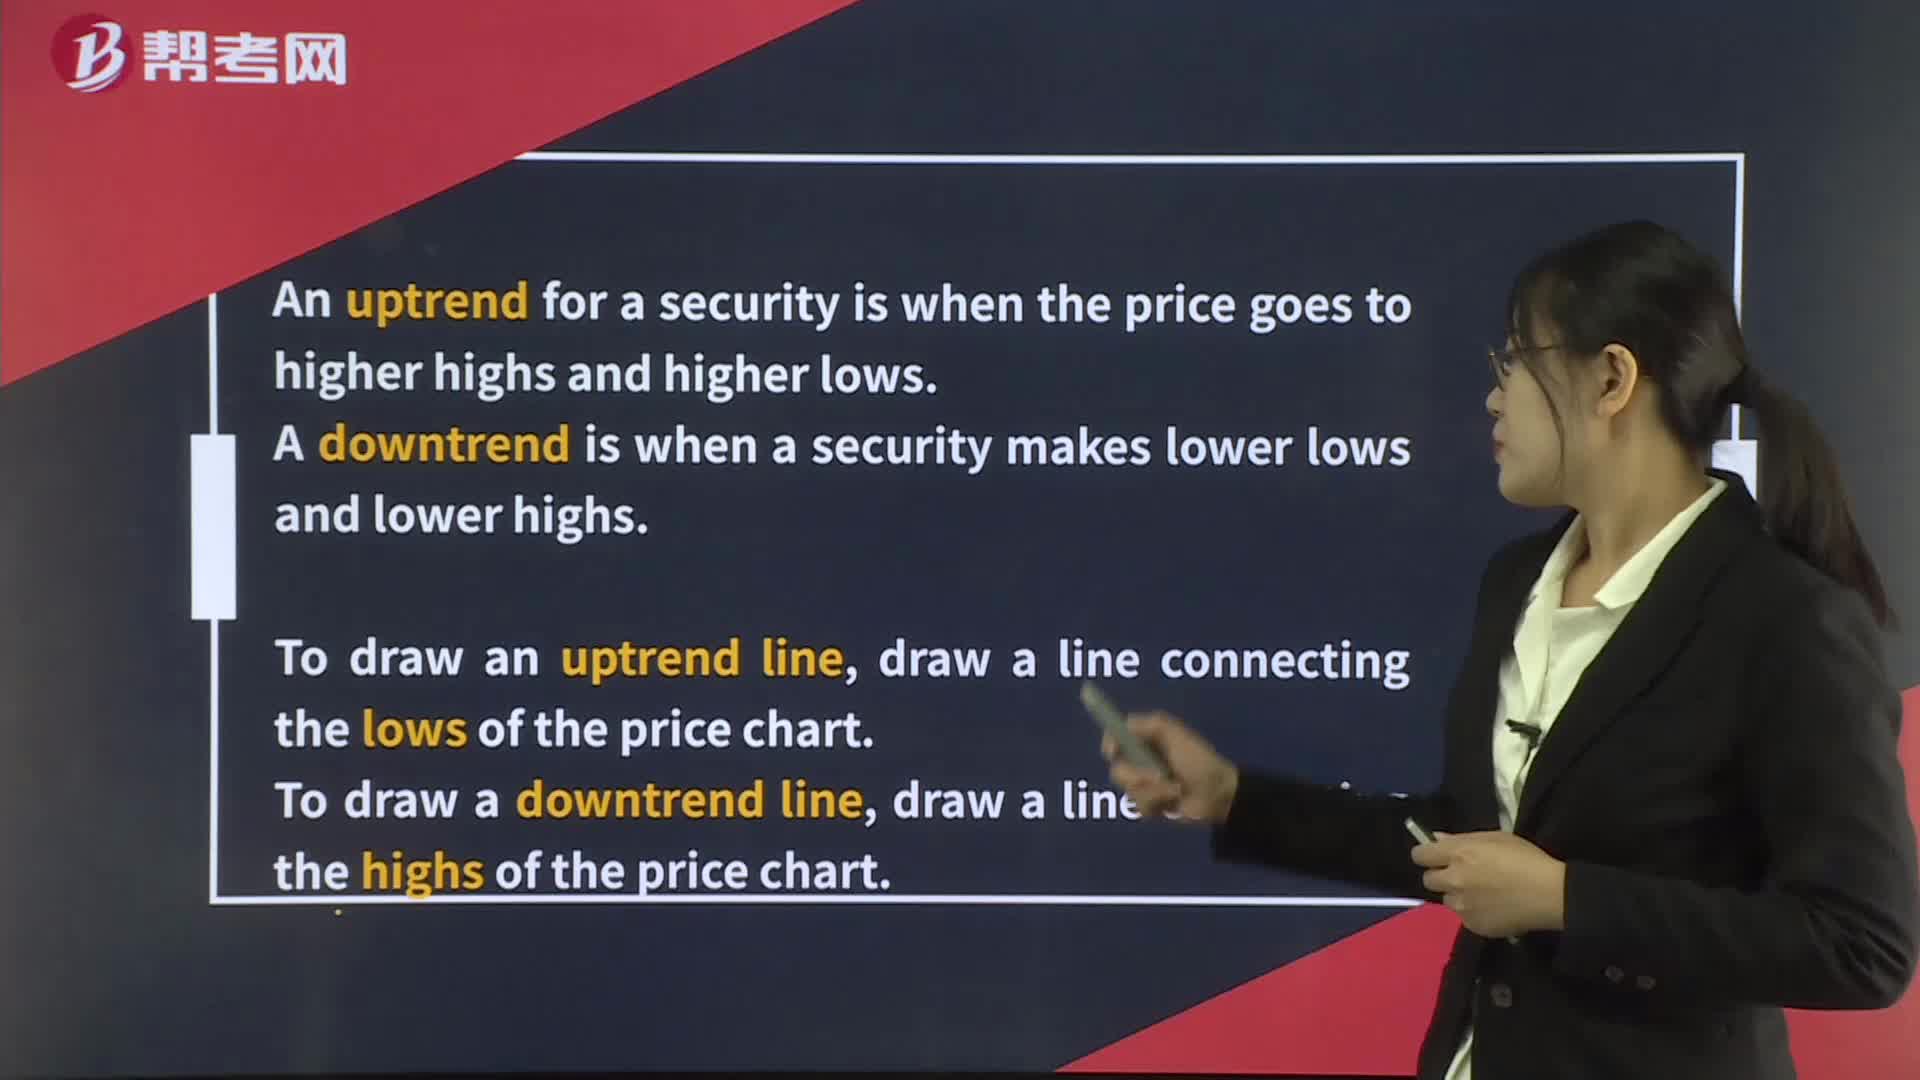
Lines
Trend lines are one of the most basic and popular technical analysis tools. They are used to identify the direction of a trend and to determine potential entry and exit points for trades. Trend lines are drawn by connecting two or more price points, either highs or lows, on a chart. A trend line that connects two or more lows is considered a support line, while a trend line that connects two or more highs is considered a resistance line.
Moving Averages
Moving averages are another popular technical analysis tool used to identify trends in the market. They are calculated by taking the average price of a security over a specific period of time, such as 50 days or 200 days. Moving averages are used to smooth out price fluctuations and to identify potential support and resistance levels. Traders use moving averages to identify the direction of a trend and to determine potential entry and exit points for trades.
MACD
The MACD (Moving Average Convergence Divergence) is a technical analysis tool that is used to identify changes in momentum and trend. It is calculated by subtracting the 26-day exponential moving average (EMA) from the 12-day EMA. A 9-day EMA of the MACD is then plotted on top of the MACD line, acting as a signal line. Traders use the MACD to identify potential buy and sell signals, as well as to confirm trends and reversals.
RSI
The RSI (Relative Strength Index) is a technical analysis tool that is used to measure the strength of a security's price action. It is calculated by comparing the average gains and losses of a security over a specific period of time, typically 14 days. The RSI is plotted on a scale from 0 to 100, with readings above 70 indicating overbought conditions and readings below 30 indicating oversold conditions. Traders use the RSI to identify potential buy and sell signals, as well as to confirm trends and reversals.
Bollinger Bands
Bollinger Bands are a technical analysis tool that is used to measure volatility and identify potential trading opportunities. They are calculated by plotting two standard deviations away from a simple moving average over a specific period of time, typically 20 days. Bollinger Bands expand and contract as volatility increases and decreases, and traders use them to identify potential buy and sell signals, as well as to confirm trends and reversals.
 幫考網(wǎng)校