下載億題庫APP
聯(lián)系電話:400-660-1360
下載億題庫APP
聯(lián)系電話:400-660-1360

請謹(jǐn)慎保管和記憶你的密碼,以免泄露和丟失
請謹(jǐn)慎保管和記憶你的密碼,以免泄露和丟失
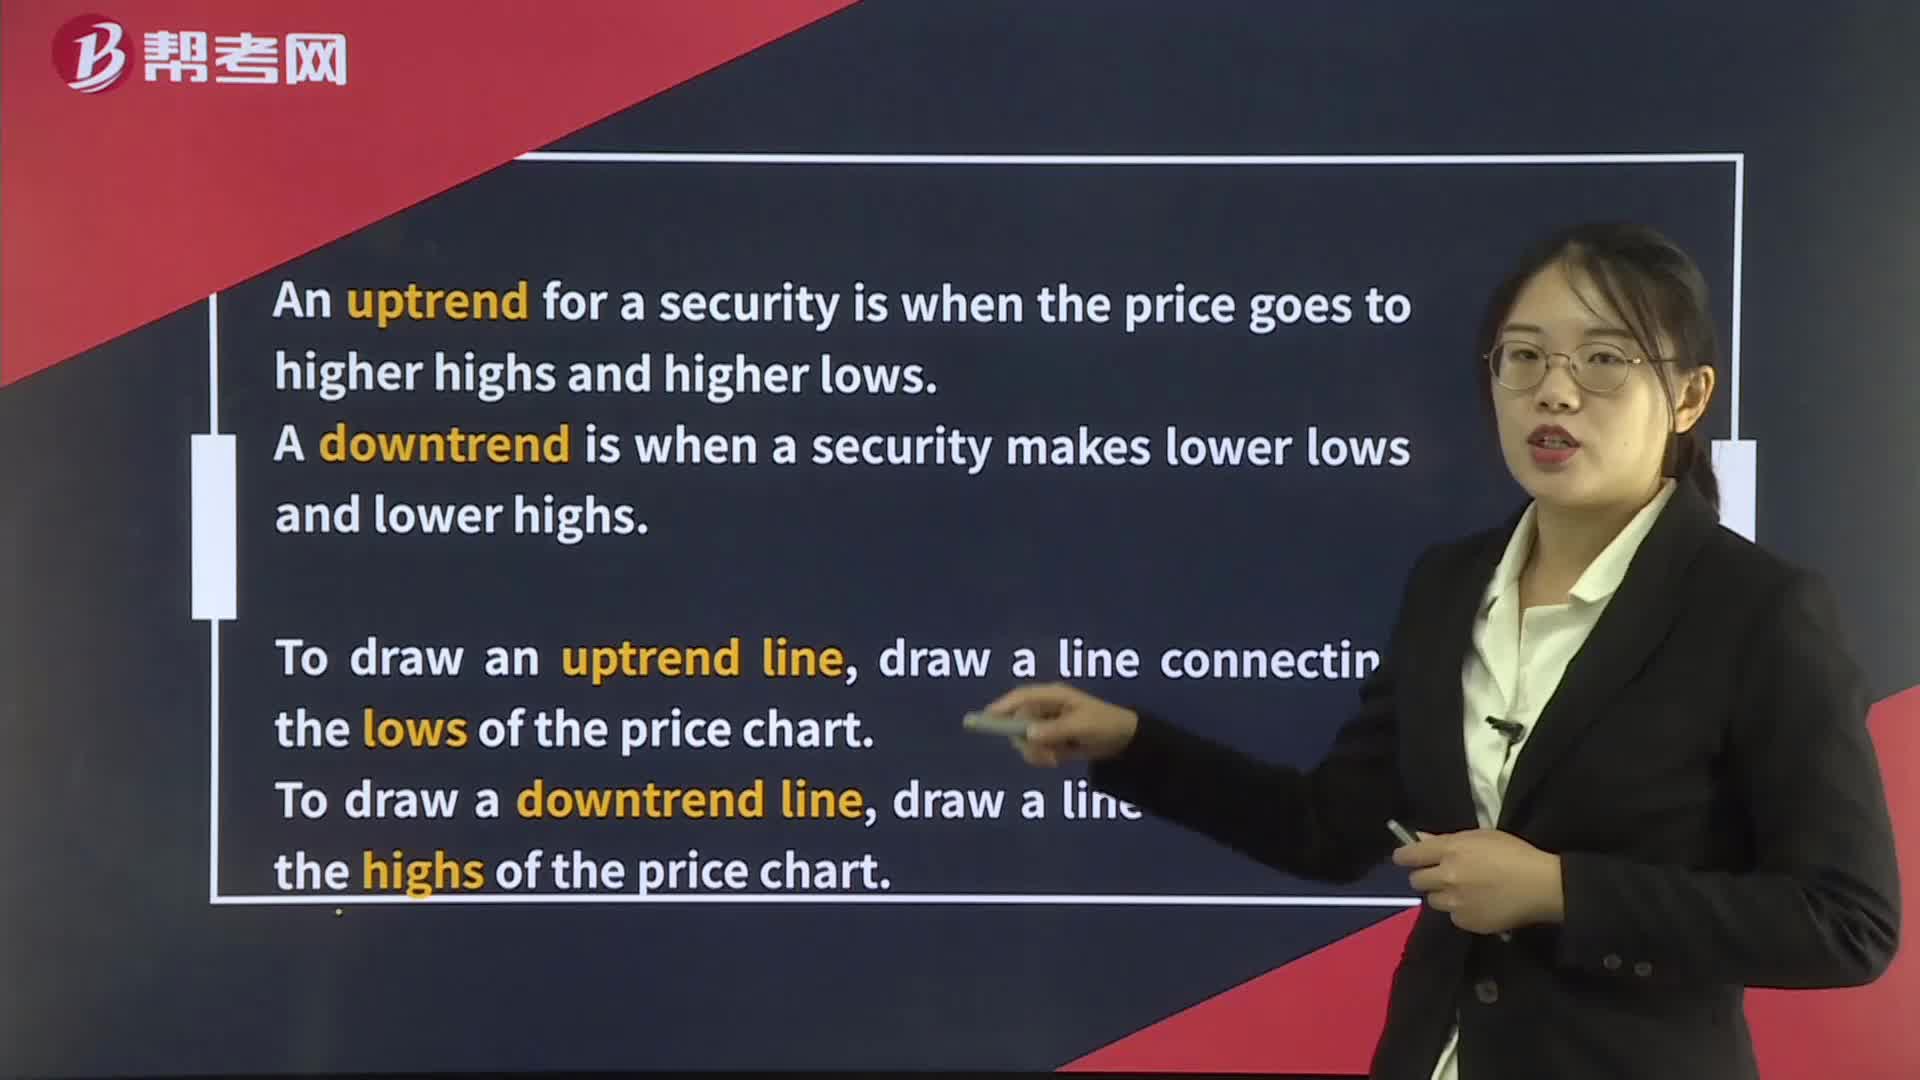
Technical Analysis Tools— Trend
An uptrend for a security is when the price goes to higher highs and higher lows.
A downtrend is when a security makes lower lows and lower highs.
To draw an uptrend line, draw a line connecting the lows of the price chart.
To draw a downtrend line, draw a line connecting the highs of the price chart.
微信截圖_1596608585183420200805142350937.png)
Major breakdowns through or below the uptrend line (e.g., 5–10 percent) indicate that the uptrend is over and may signal a further decline in the price.
Major breakouts above the downtrend line (e.g., 5–10 percent) indicate that the downtrend is over and a rise in the security’s price may occur.
微信截圖_1596608540467220200805142413995.png)
[Practice Problems] The exhibit depicts GreatWall Information Industry Co., Ltd., ordinary shares, traded on the Shenzhen Stock Exchange, for late 2008 through late 2009 in renminbi (RMB). The uptrend was most likely broken at a price level nearest to:
7 RMB.
8.5 RMB.
10 RMB.
微信截圖_1596608549954120200805142435954.png)
[Solutions] B
Share price breaks through trend line at approximately RMB 8.5
Support is a low price range in which buying activity is sufficient to stop the decline in price.
Resistance is a price range in which selling is sufficient to stop the rise in price.
Change in polarity principle states that once a support level is breached, it becomes a resistance level.
 241
241Technical Analysis Tools— Trend:line,draw a line connecting the highs of the price chart.:price.[PracticeLtd.Change
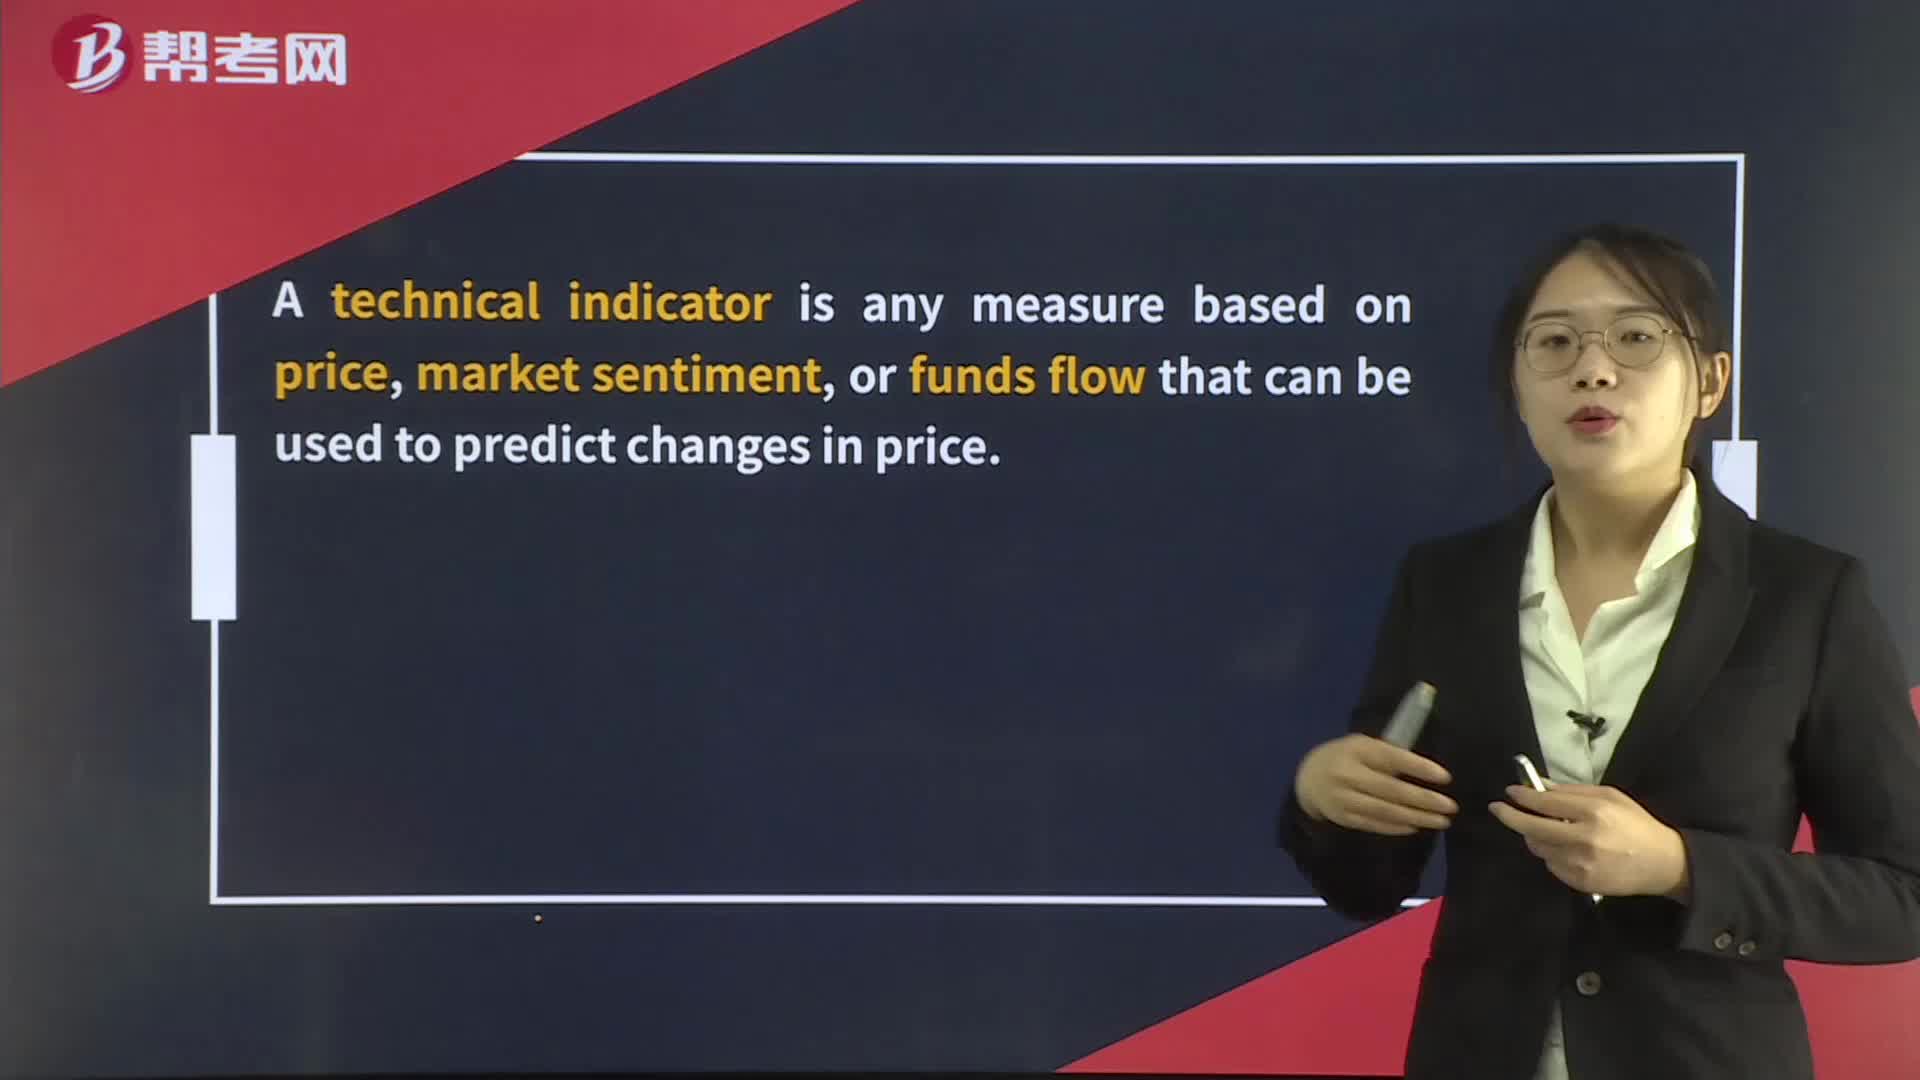 18
18Technical Analysis Tools— Technical Indicators:changes in price.
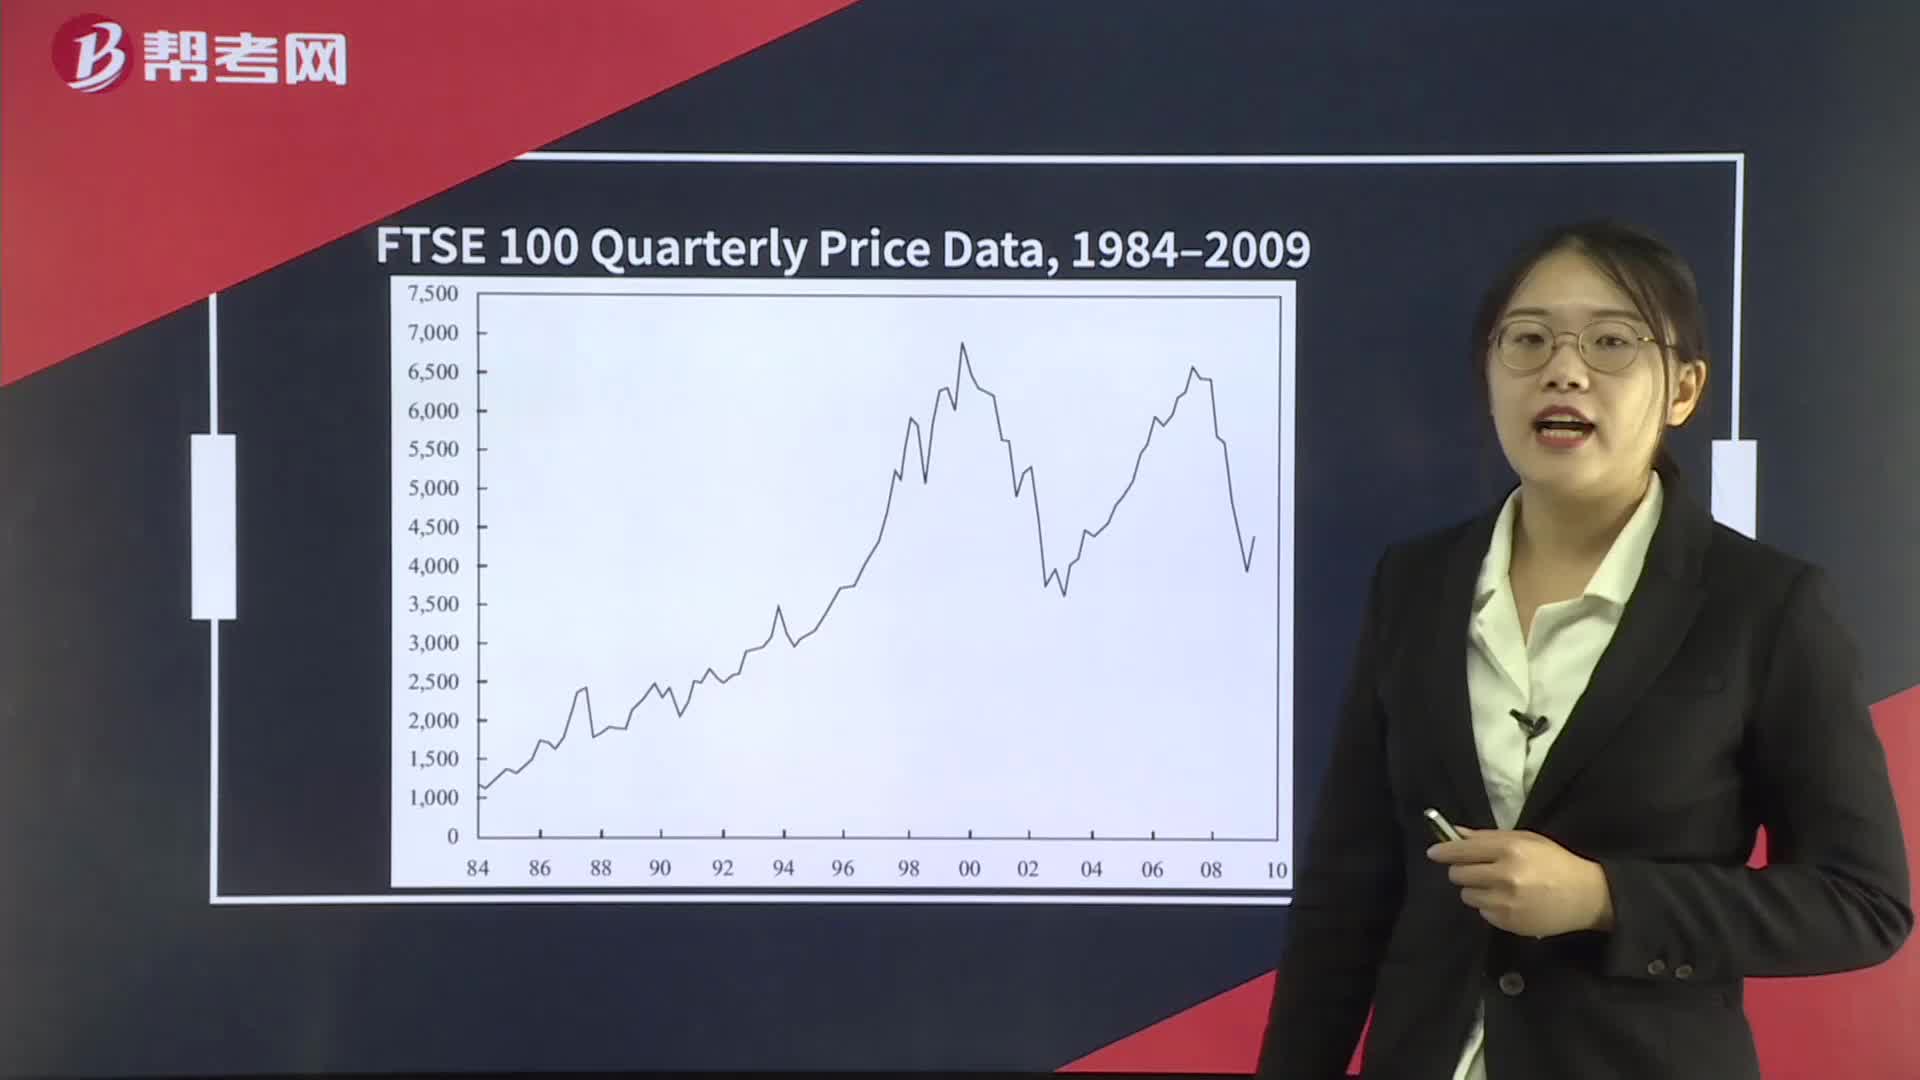 589
589Technical Analysis Tools— Charts:Bar,First,size.,Box,meaning.?scalee.g.[Practice

微信掃碼關(guān)注公眾號
獲取更多考試熱門資料