
下載億題庫APP
聯(lián)系電話:400-660-1360
下載億題庫APP
聯(lián)系電話:400-660-1360

請(qǐng)謹(jǐn)慎保管和記憶你的密碼,以免泄露和丟失
請(qǐng)謹(jǐn)慎保管和記憶你的密碼,以免泄露和丟失
Technical Analysis Tools— Charts
Charts (Line, Bar, Candlestick, Point and Figure).
微信截圖_1596607406402520200805140402286.png)
微信截圖_1596606923877420200805140443771.png)
微信截圖_1596606932171020200805141008138.png)
微信截圖_1596606939756920200805141208125.png)
微信截圖_1596606947195720200805141322652.png)
First, determine the box size and the reversal size.
Box size refers to the change in price represented by the height of each box (boxes are generally square, but the width has no meaning).
The reversal size is used to determine when to create a new column. (most common size is 3)
The horizontal axis represents the number of changes in price, not time.
The vertical axis measures discrete increments of price.
X represents an increase in price and O represents a decline in price.
A logarithmic scale, equal vertical distances on the chart correspond to an equal percentage change, appropriate when the data move through a range of values representing several orders of magnitude (e.g., from 10 to 10,000);
A linear scale(arithmetic scale) is better suited for narrower ranges.
微信截圖_1596606977647020200805141503510.png)
[Practice Problems] In constructing a chart, using a logarithmic scale on the vertical axis is likely to be most useful for which of the following applications?
A. The price of gold for the past 100 years.
B. The share price of a company over the past month.
C. Yields on 10-year US Treasuries for the past 5 years.
[Solutions] A
The price of gold in nominal dollars was several orders of magnitude cheaper 100 years ago than it is today (roughly US$20 then versus US$1,100 today). Such a wide range of prices lends itself well to being graphically displayed on a logarithmic scale.
Volume is used to assess the strength or conviction of buyers and sellers in determining a security’s price.
Long intervals: chart longer time periods, contain fewer data points, so a longer time frame can be presented on the chart.
Short intervals: see more detail.
 241
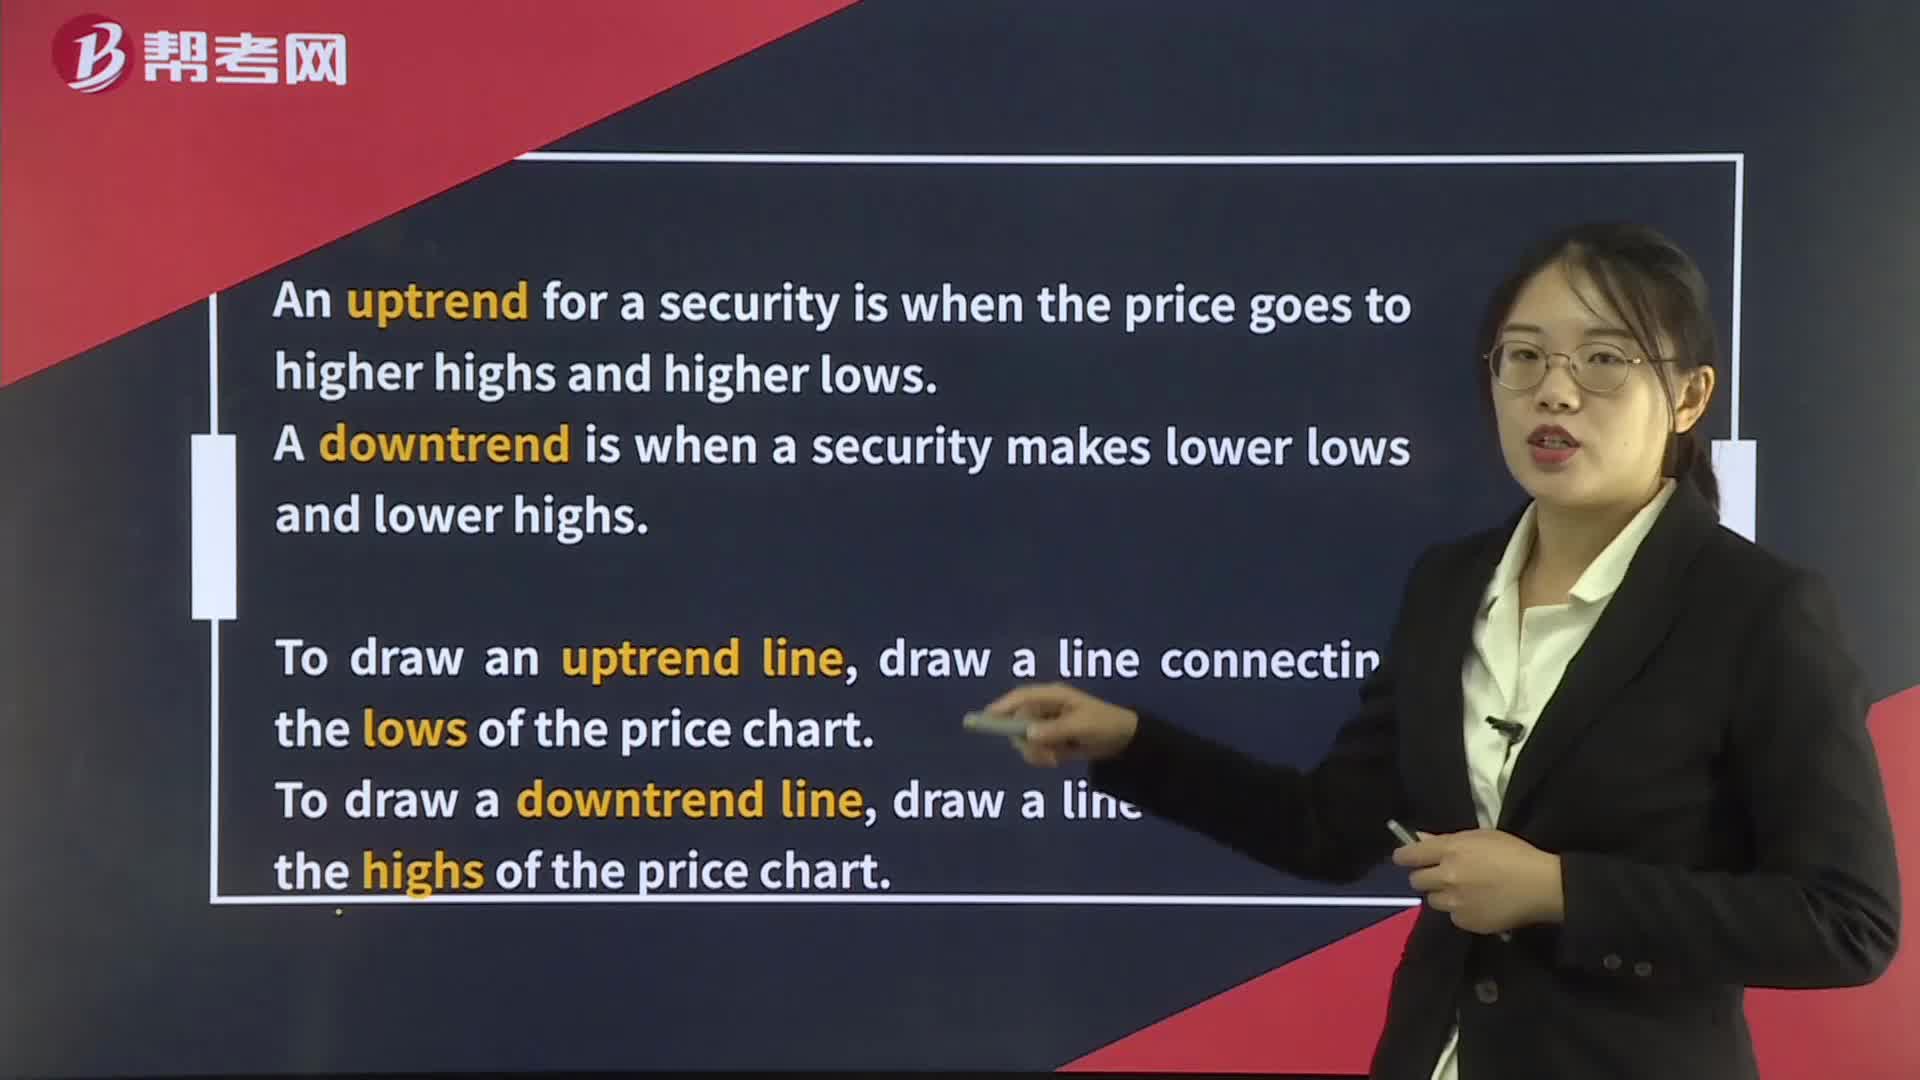
241Technical Analysis Tools— Trend:line,draw a line connecting the highs of the price chart.:price.[PracticeLtd.Change
 235
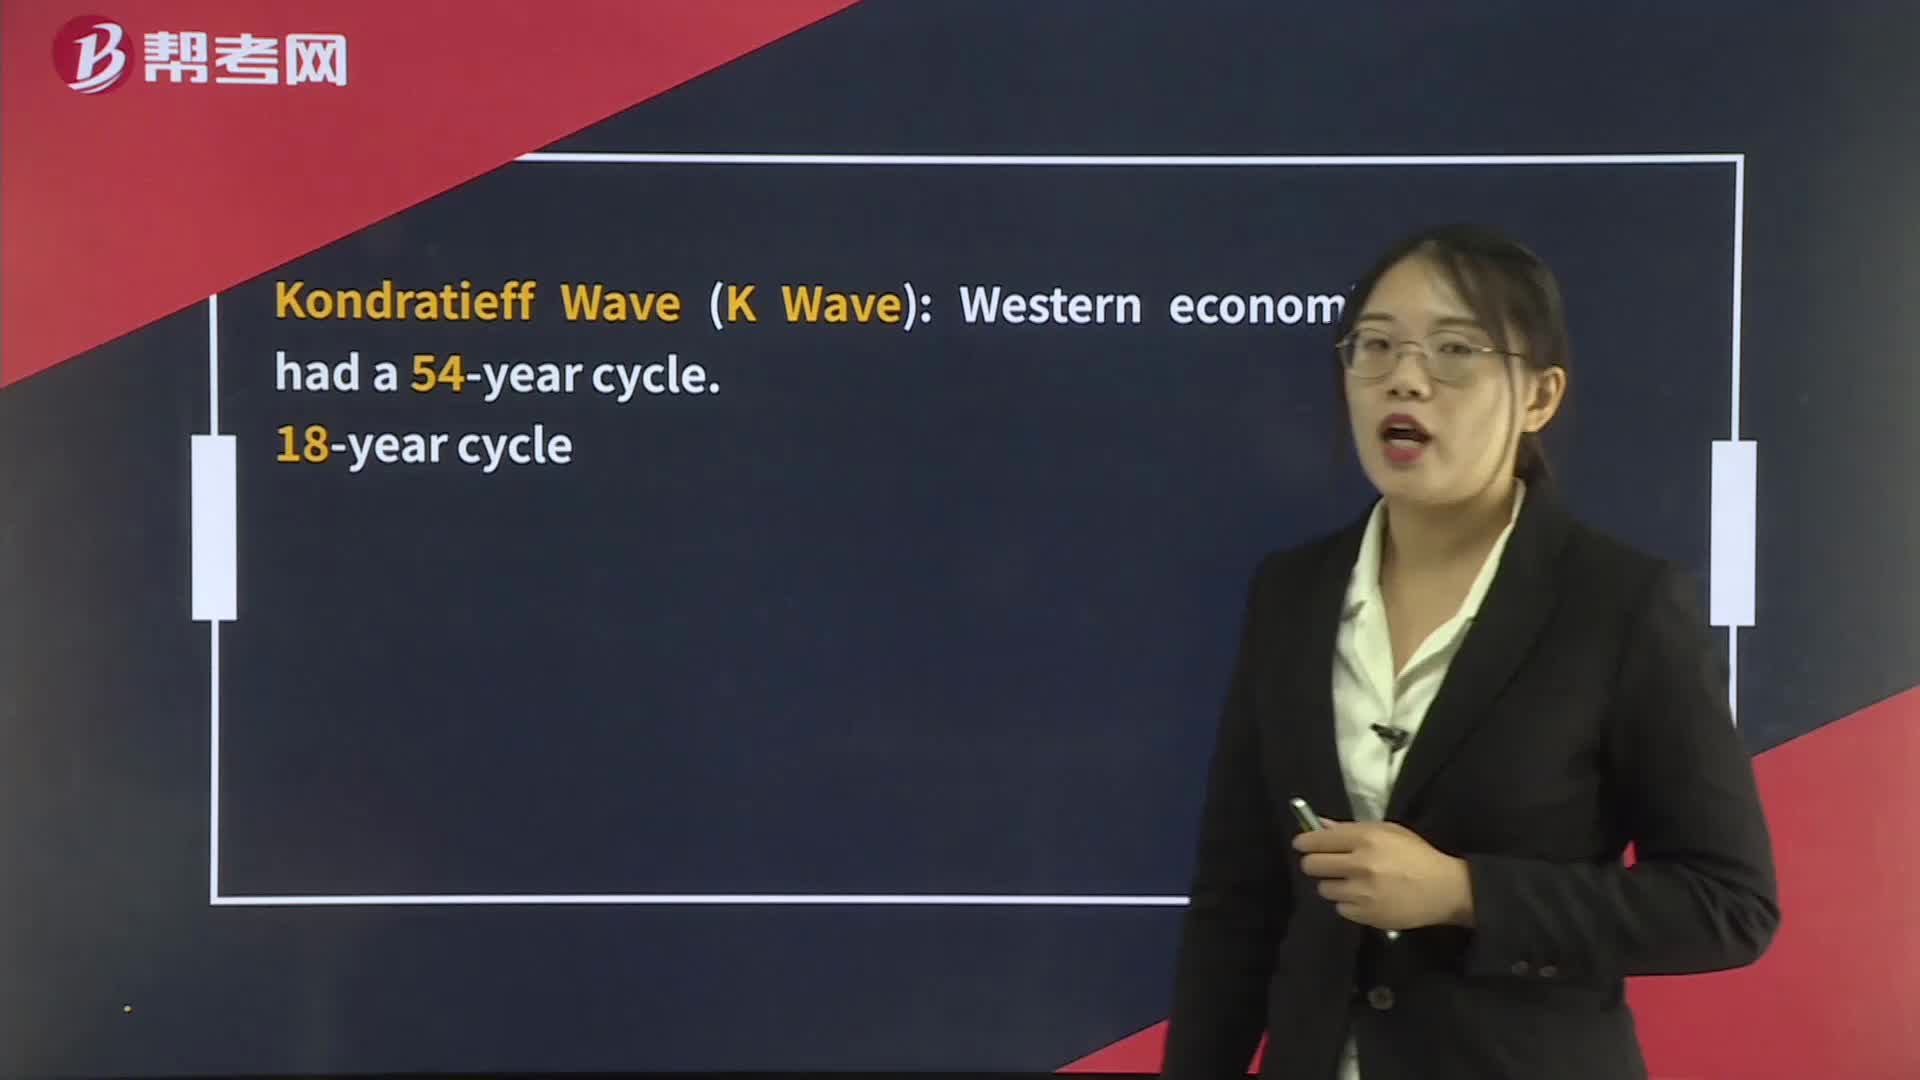
235Technical Analysis Tools— Cycles:Wave K Wave:cyclePatternCyclePost-election years and the midterm year have[Practice
 18
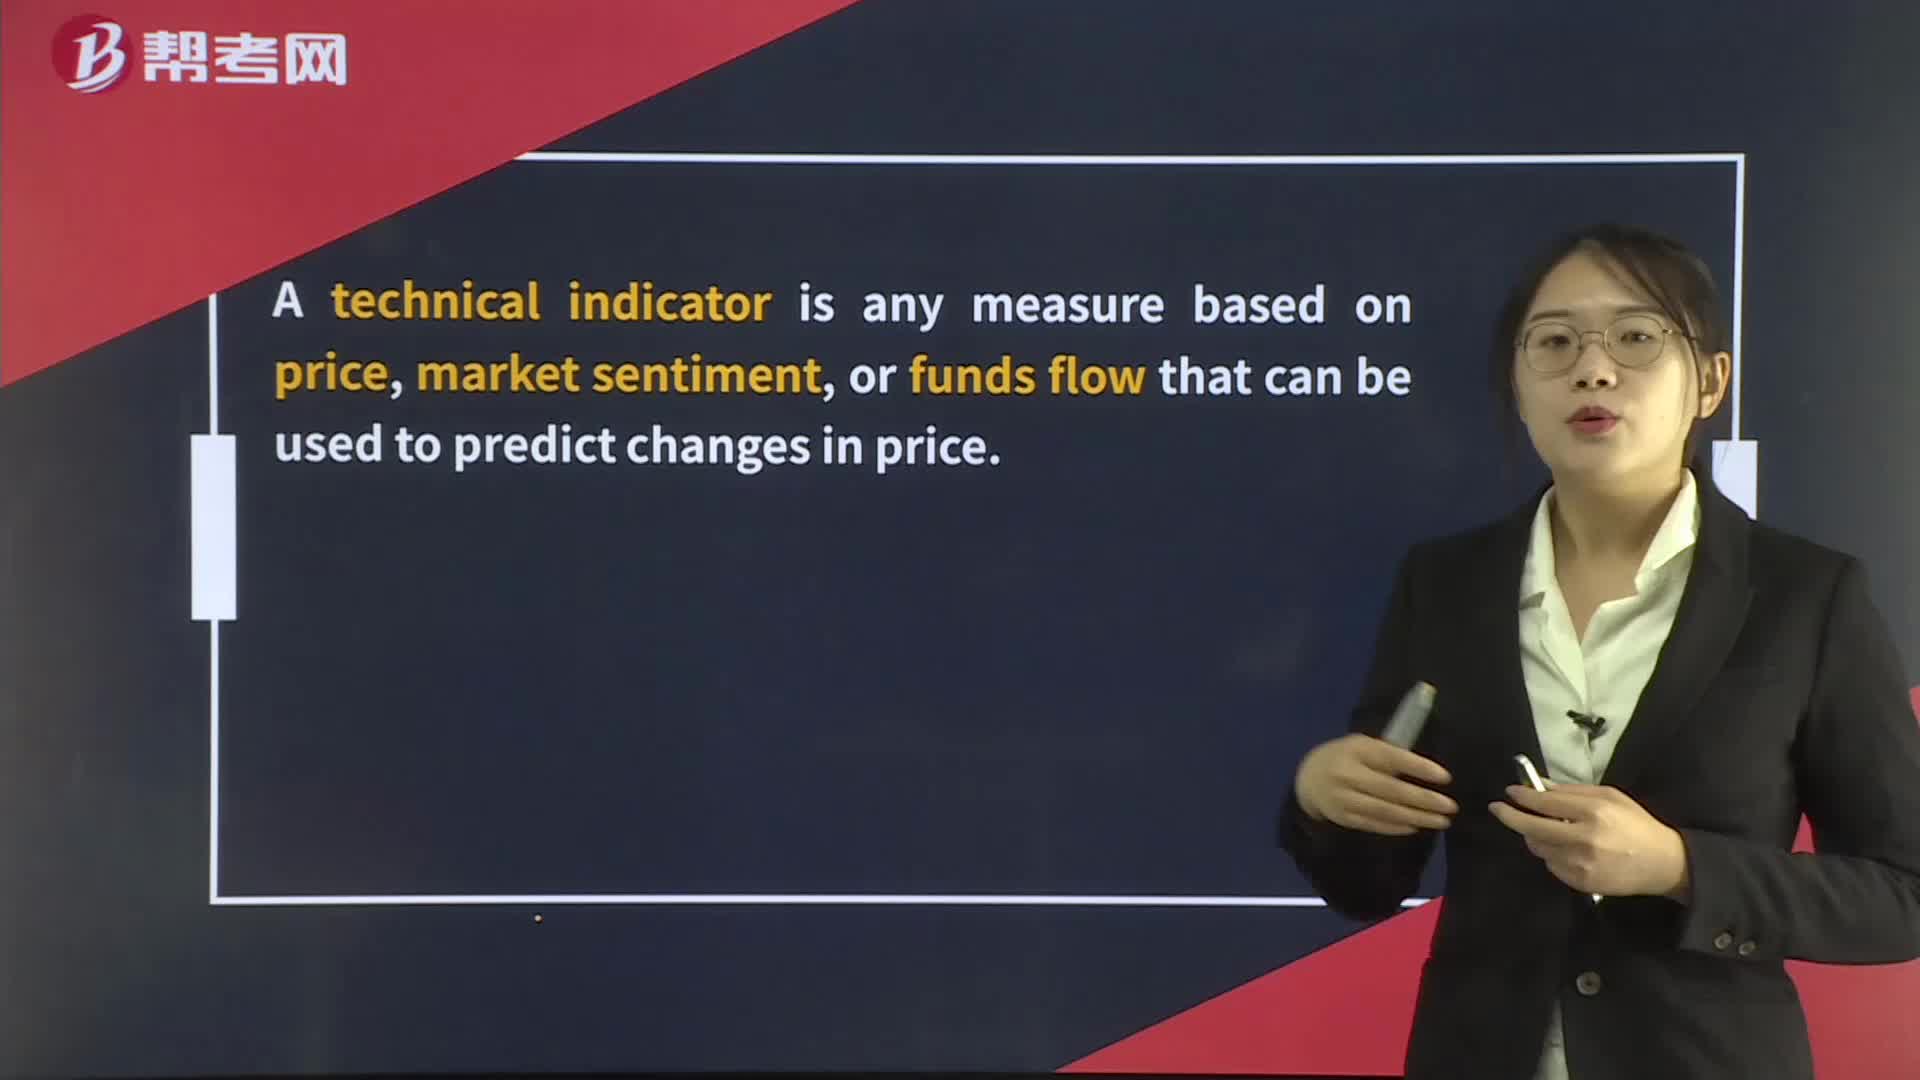
18Technical Analysis Tools— Technical Indicators:changes in price.

微信掃碼關(guān)注公眾號(hào)
獲取更多考試熱門資料