下載億題庫APP
聯(lián)系電話:400-660-1360
下載億題庫APP
聯(lián)系電話:400-660-1360
請謹慎保管和記憶你的密碼,以免泄露和丟失
請謹慎保管和記憶你的密碼,以免泄露和丟失
Technical Analysis Tools— Continuation Patterns
A continuation pattern is used to predict the resumption of a market trend that was in place prior to the formation of a pattern.
Triangle patterns come in three forms, symmetrical triangles, ascending triangles, and descending triangles.
微信截圖_1596761377807320200807084955891.png)
微信截圖_1596761417471620200807085044507.png)
微信截圖_1596761468495820200807085128943.png)
Flags and pennants form over short periods of time—on a daily price chart, typically over a week.
Flag: parallel trendlines.
Pennant: trendlines converge.
A pennant is a short-term formation whereas a triangle is a long-term formation.
The expectation: the trend will continue after the pattern in the same direction it was going prior to the pattern.
The price is expected to change by at least the same amount as the price change from the start of the trend to the formation of the flag or pennant.
微信截圖_1596761517345320200807085215721.png)
 241
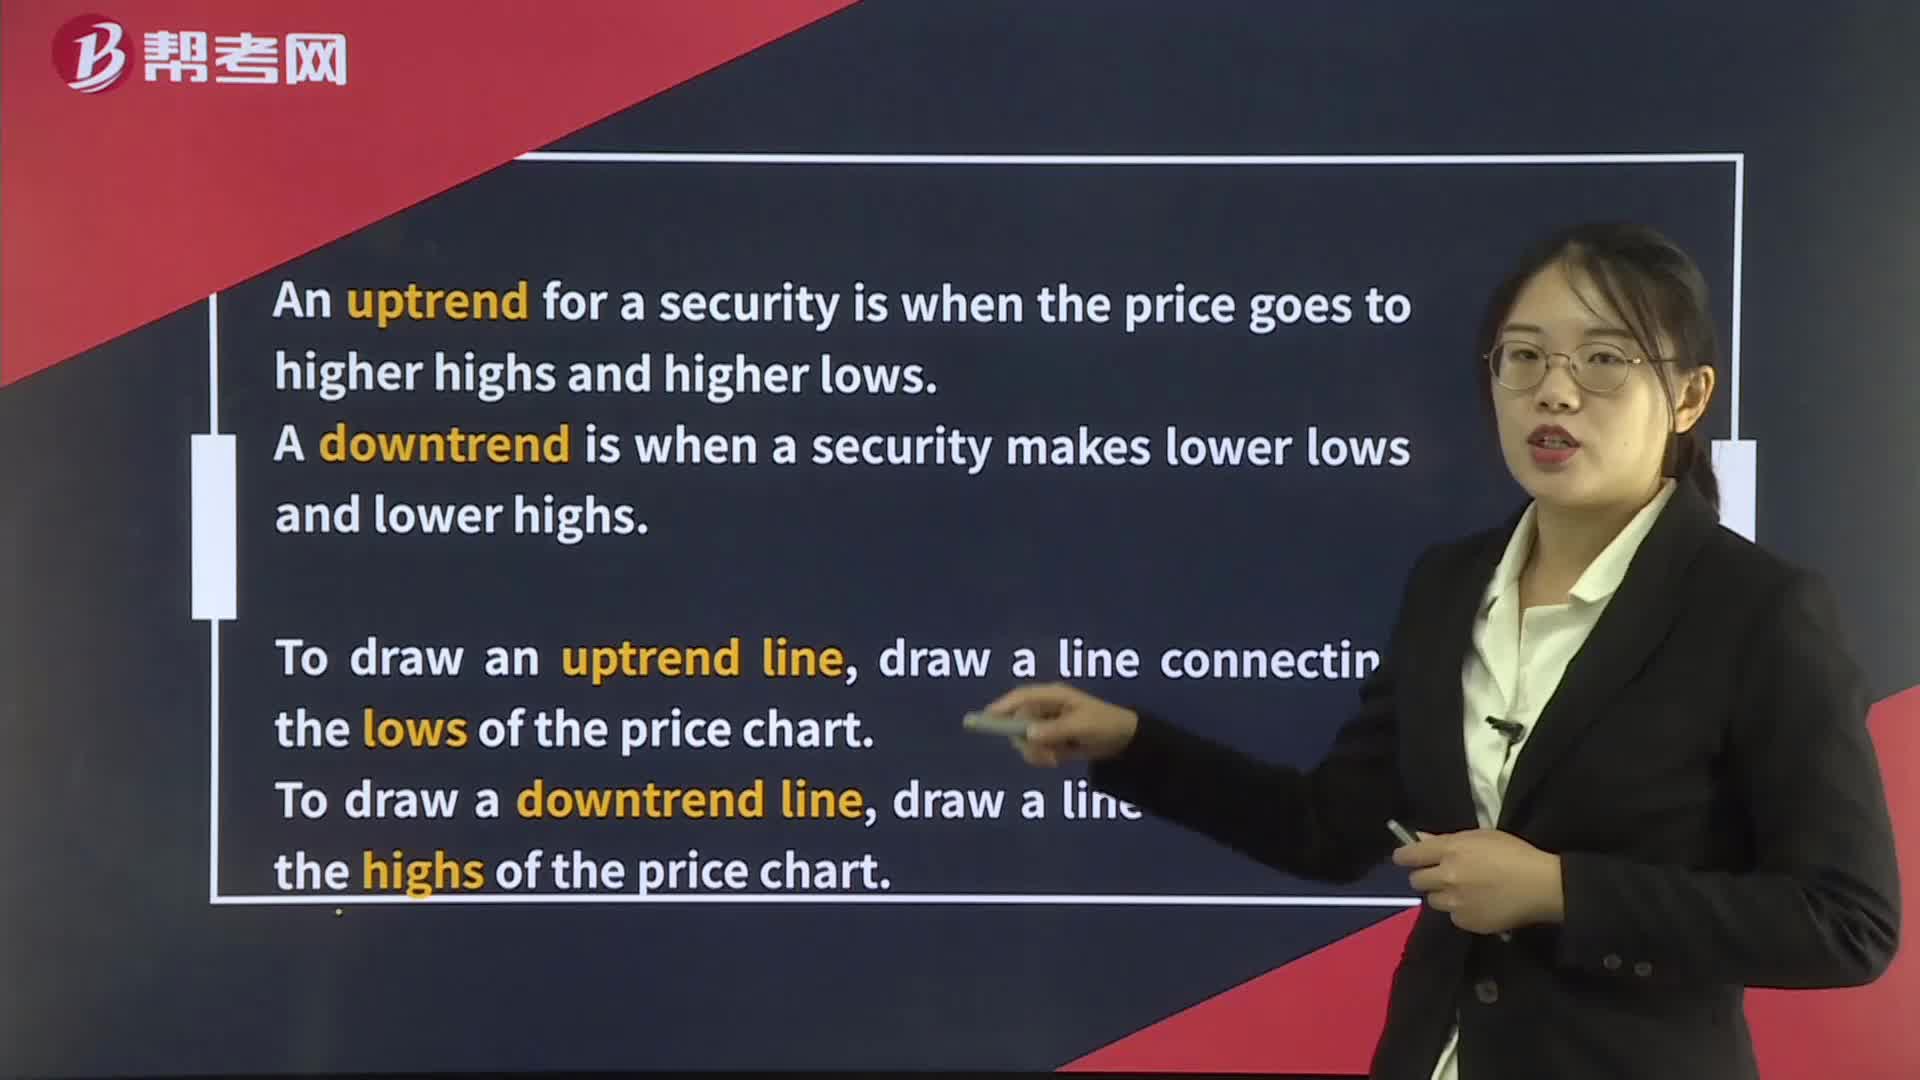
241Technical Analysis Tools— Trend:line,draw a line connecting the highs of the price chart.:price.[PracticeLtd.Change
 345
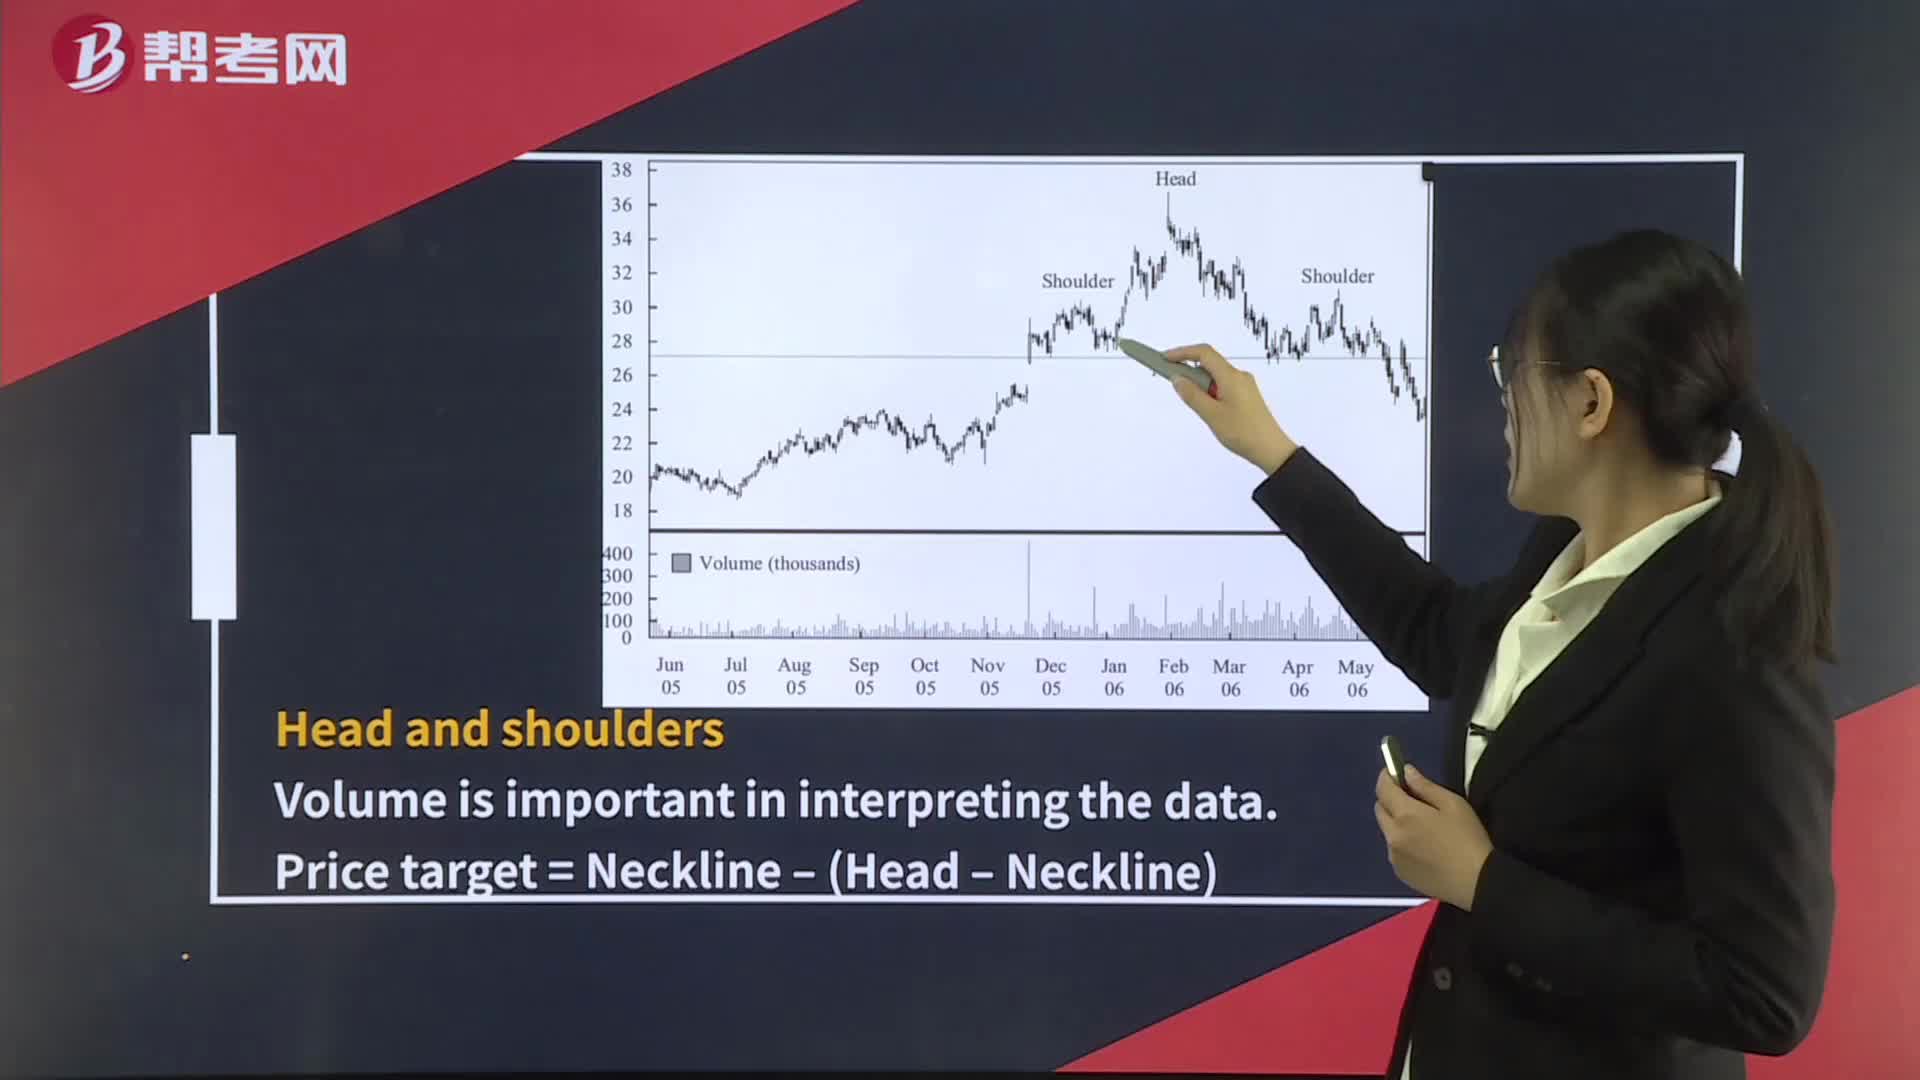
345Technical Analysis Tools— Reversal Patterns:Doublethe price is expected to appreciate above the peak between the two bottoms by at least the distance from the valley lows to the peak.
 391
391Technical Analysis Tools— Continuation Patterns:Triangle:symmetrical triangles:FlagsFlagA pennant is a short-term formation whereas a triangle is a long-term formation.flag or pennant.

微信掃碼關(guān)注公眾號
獲取更多考試熱門資料