下載億題庫(kù)APP
聯(lián)系電話:400-660-1360
下載億題庫(kù)APP
聯(lián)系電話:400-660-1360

請(qǐng)謹(jǐn)慎保管和記憶你的密碼,以免泄露和丟失
請(qǐng)謹(jǐn)慎保管和記憶你的密碼,以免泄露和丟失
Technical Analysis Tools— Chart Patterns
Chart patterns are formations that appear in price charts that create some type of recognizable shape.
Categories: reversal patterns and continuation patterns.
微信截圖_1596710117947320200806183523980.png)
 241
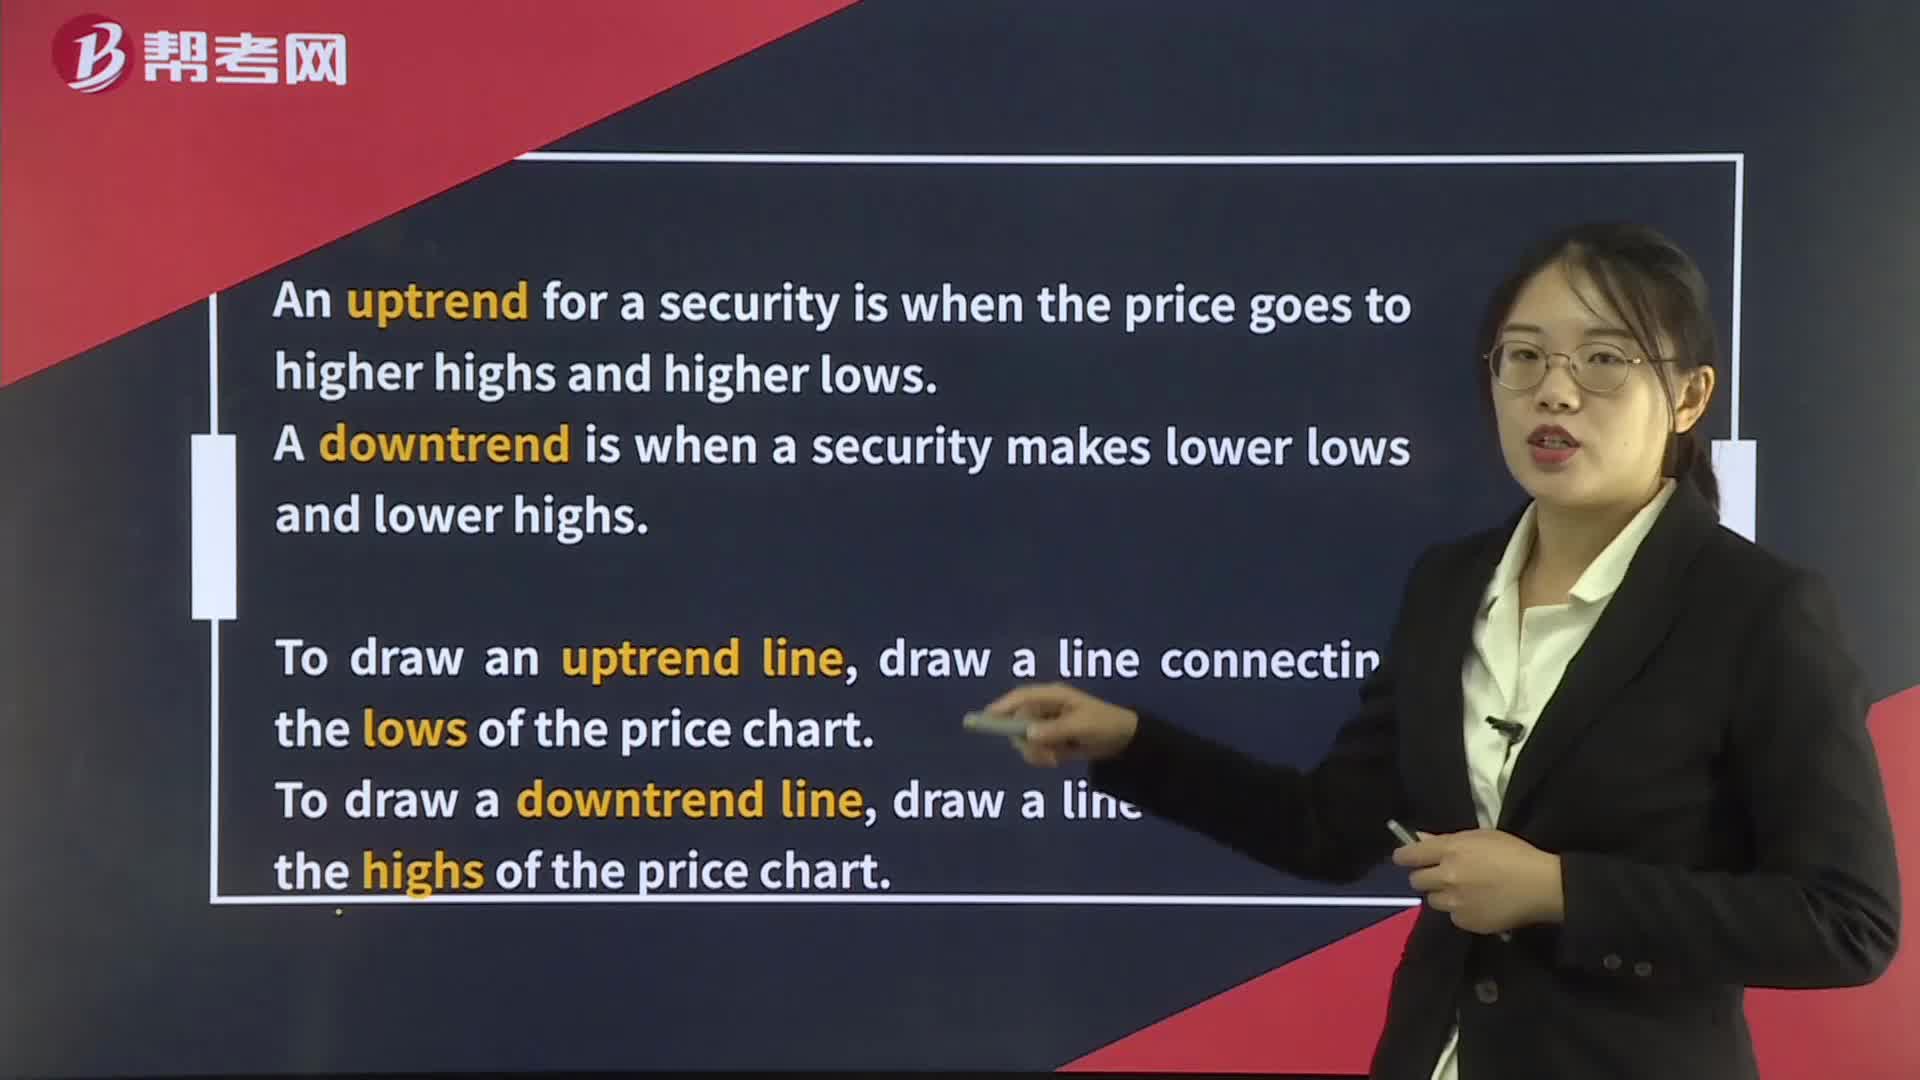
241Technical Analysis Tools— Trend:line,draw a line connecting the highs of the price chart.:price.[PracticeLtd.Change
 345
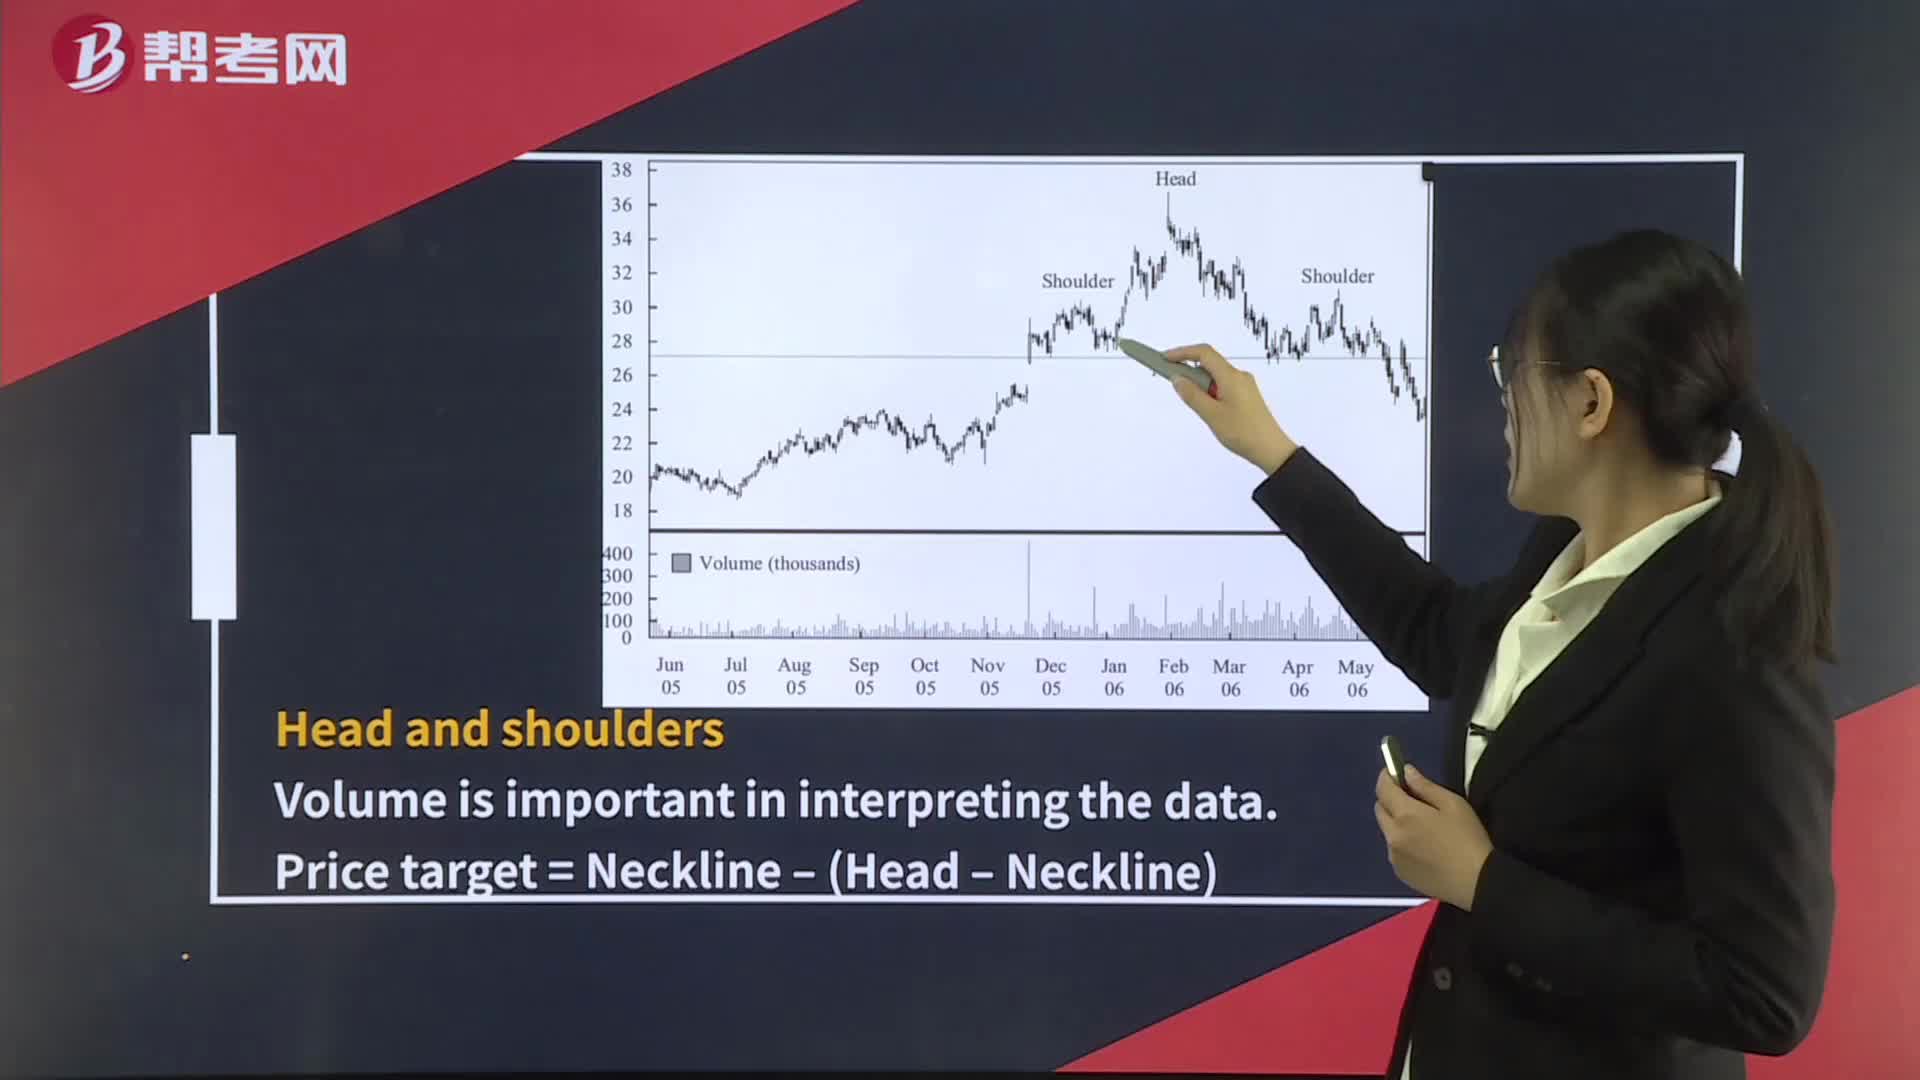
345Technical Analysis Tools— Reversal Patterns:Doublethe price is expected to appreciate above the peak between the two bottoms by at least the distance from the valley lows to the peak.
 391
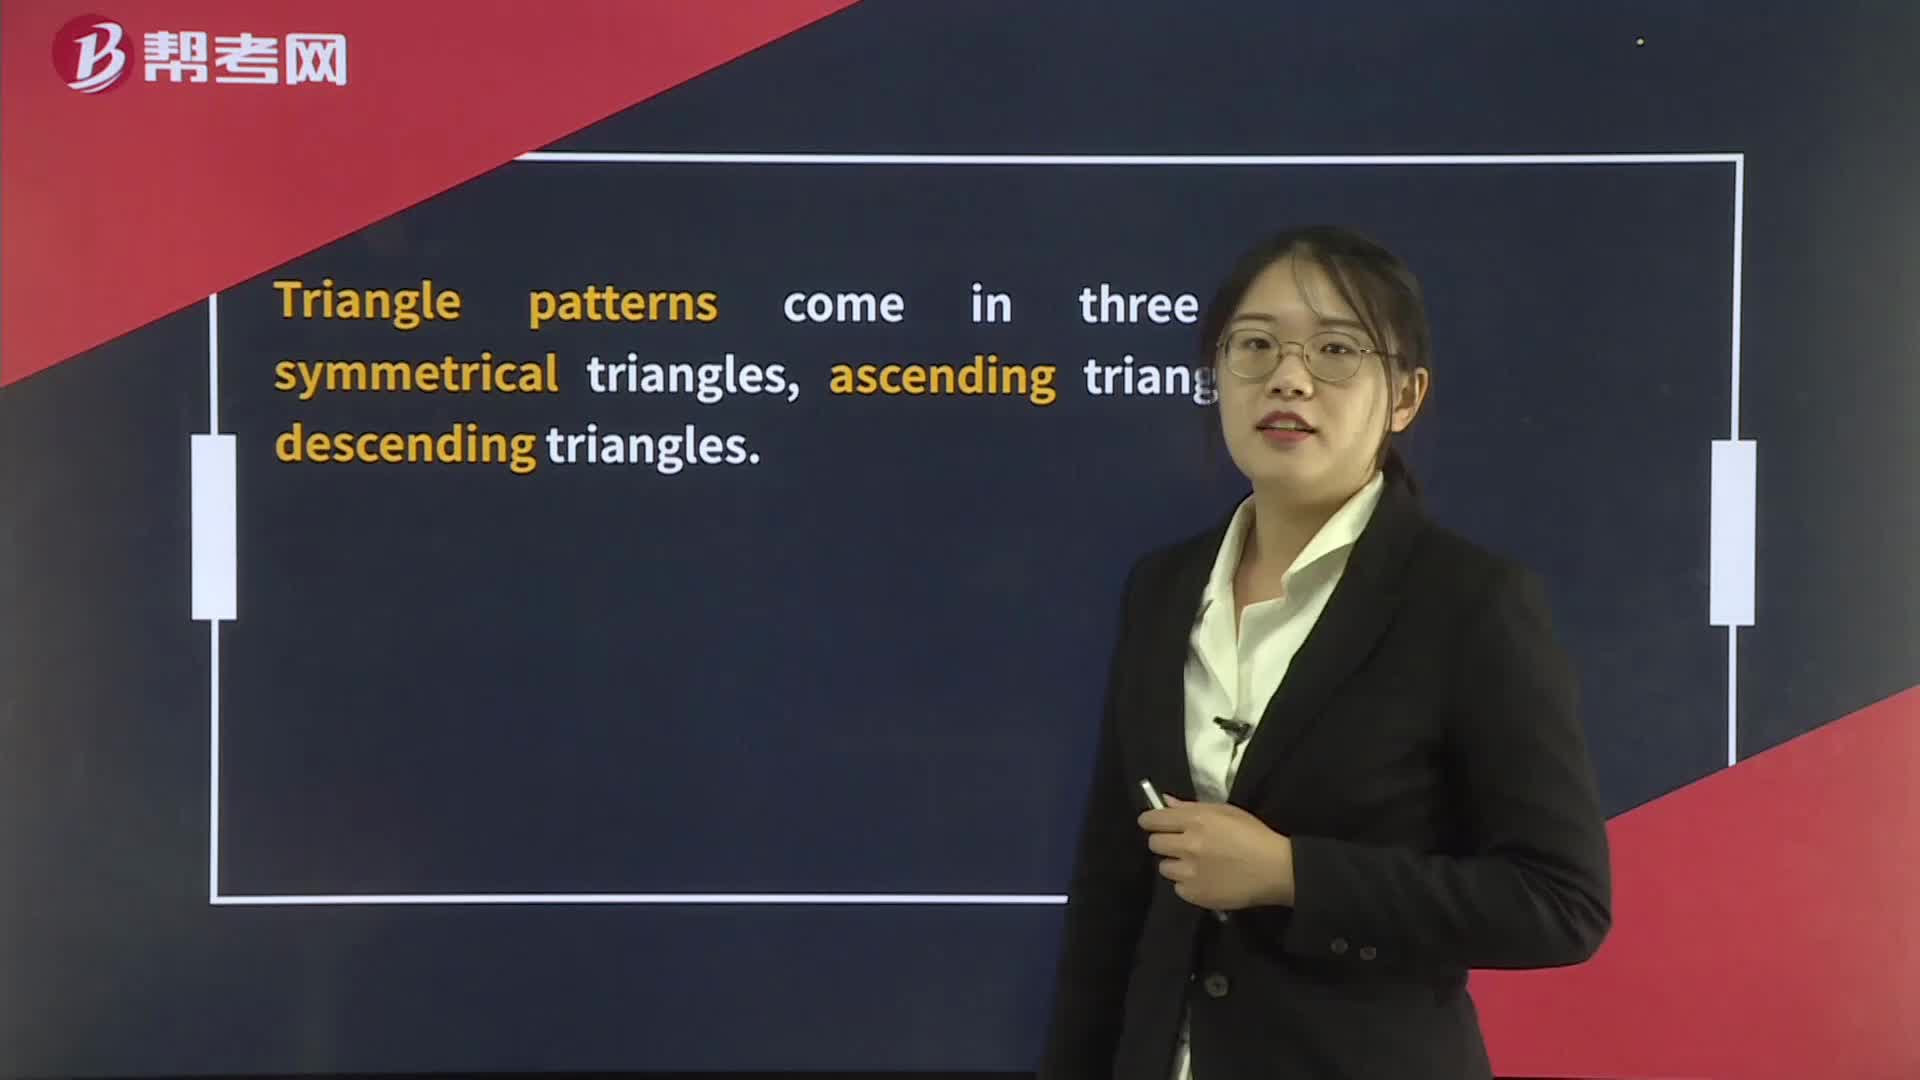
391Technical Analysis Tools— Continuation Patterns:Triangle:symmetrical triangles:FlagsFlagA pennant is a short-term formation whereas a triangle is a long-term formation.flag or pennant.

微信掃碼關(guān)注公眾號(hào)
獲取更多考試熱門(mén)資料