
下載億題庫(kù)APP
聯(lián)系電話:400-660-1360
下載億題庫(kù)APP
聯(lián)系電話:400-660-1360

請(qǐng)謹(jǐn)慎保管和記憶你的密碼,以免泄露和丟失
請(qǐng)謹(jǐn)慎保管和記憶你的密碼,以免泄露和丟失
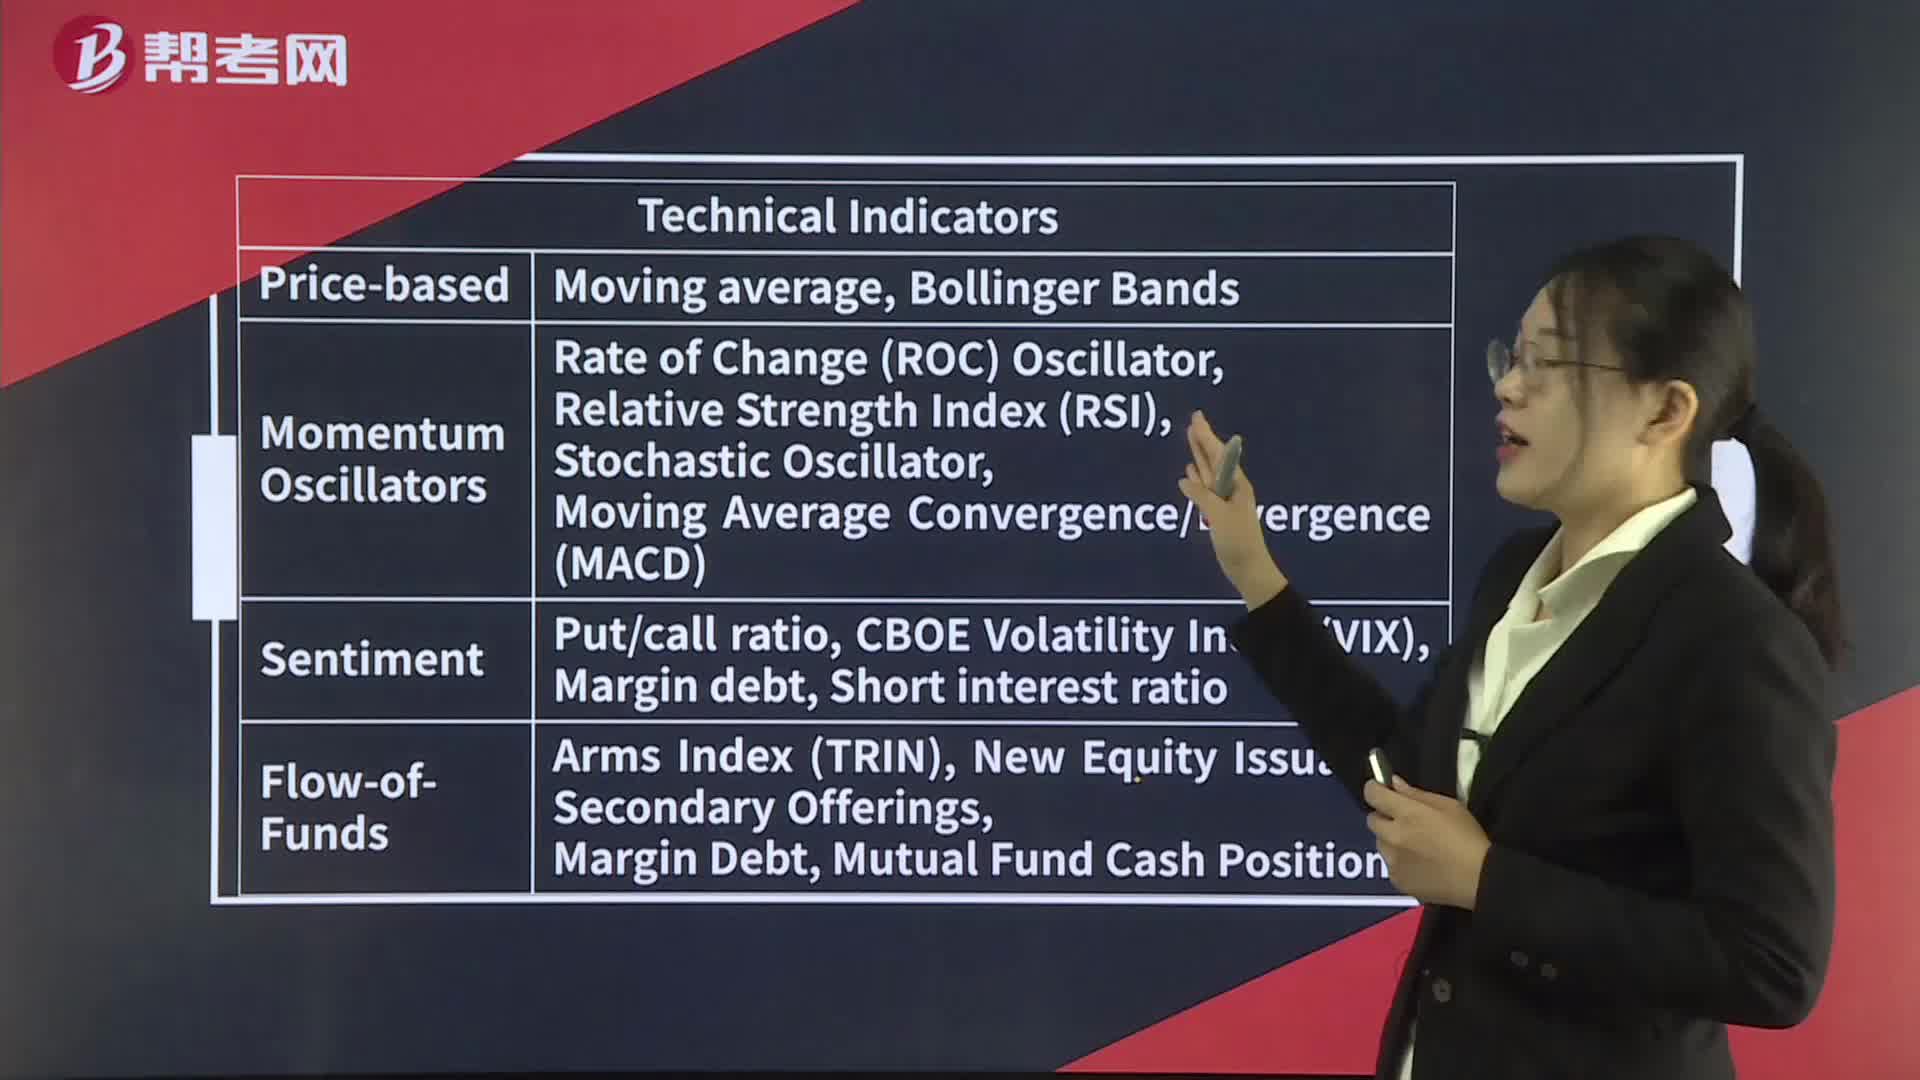
Technical Indicators— Summary
微信截圖_1596780845580920200807141422132.png)
[Practice Problems] Bollinger Bands are constructed by plotting:
A. a MACD line and a signal line.
B. a moving-average line with an uptrend line above and downtrend line below.
C. a moving-average line with upper and lower lines that are at a set number of standard deviations apart.
[Solutions] C
Bollinger Bands consist of a moving average and a higher line representing the moving average plus a set number of standard deviations from average price (for the same number of periods as used to calculate the moving average) and a lower line that is a moving average minus the same number of standard deviations.
[Practice Problems] Which of the following is not a momentum oscillator?
A. MACD.
B. Stochastic oscillator.
C. Bollinger Bands.
[Solutions] C
Bollinger Bands are price-based indicators, not momentum oscillators, which are constructed so that they oscillate between a high and a low or around 0 or 100.
 183
183Technical Indicators— Summary:Technical Indicators— Summary:C. a moving-average line with[Practiceconstructed so that they oscillate between a high and a low or around 0 or 100.
 328
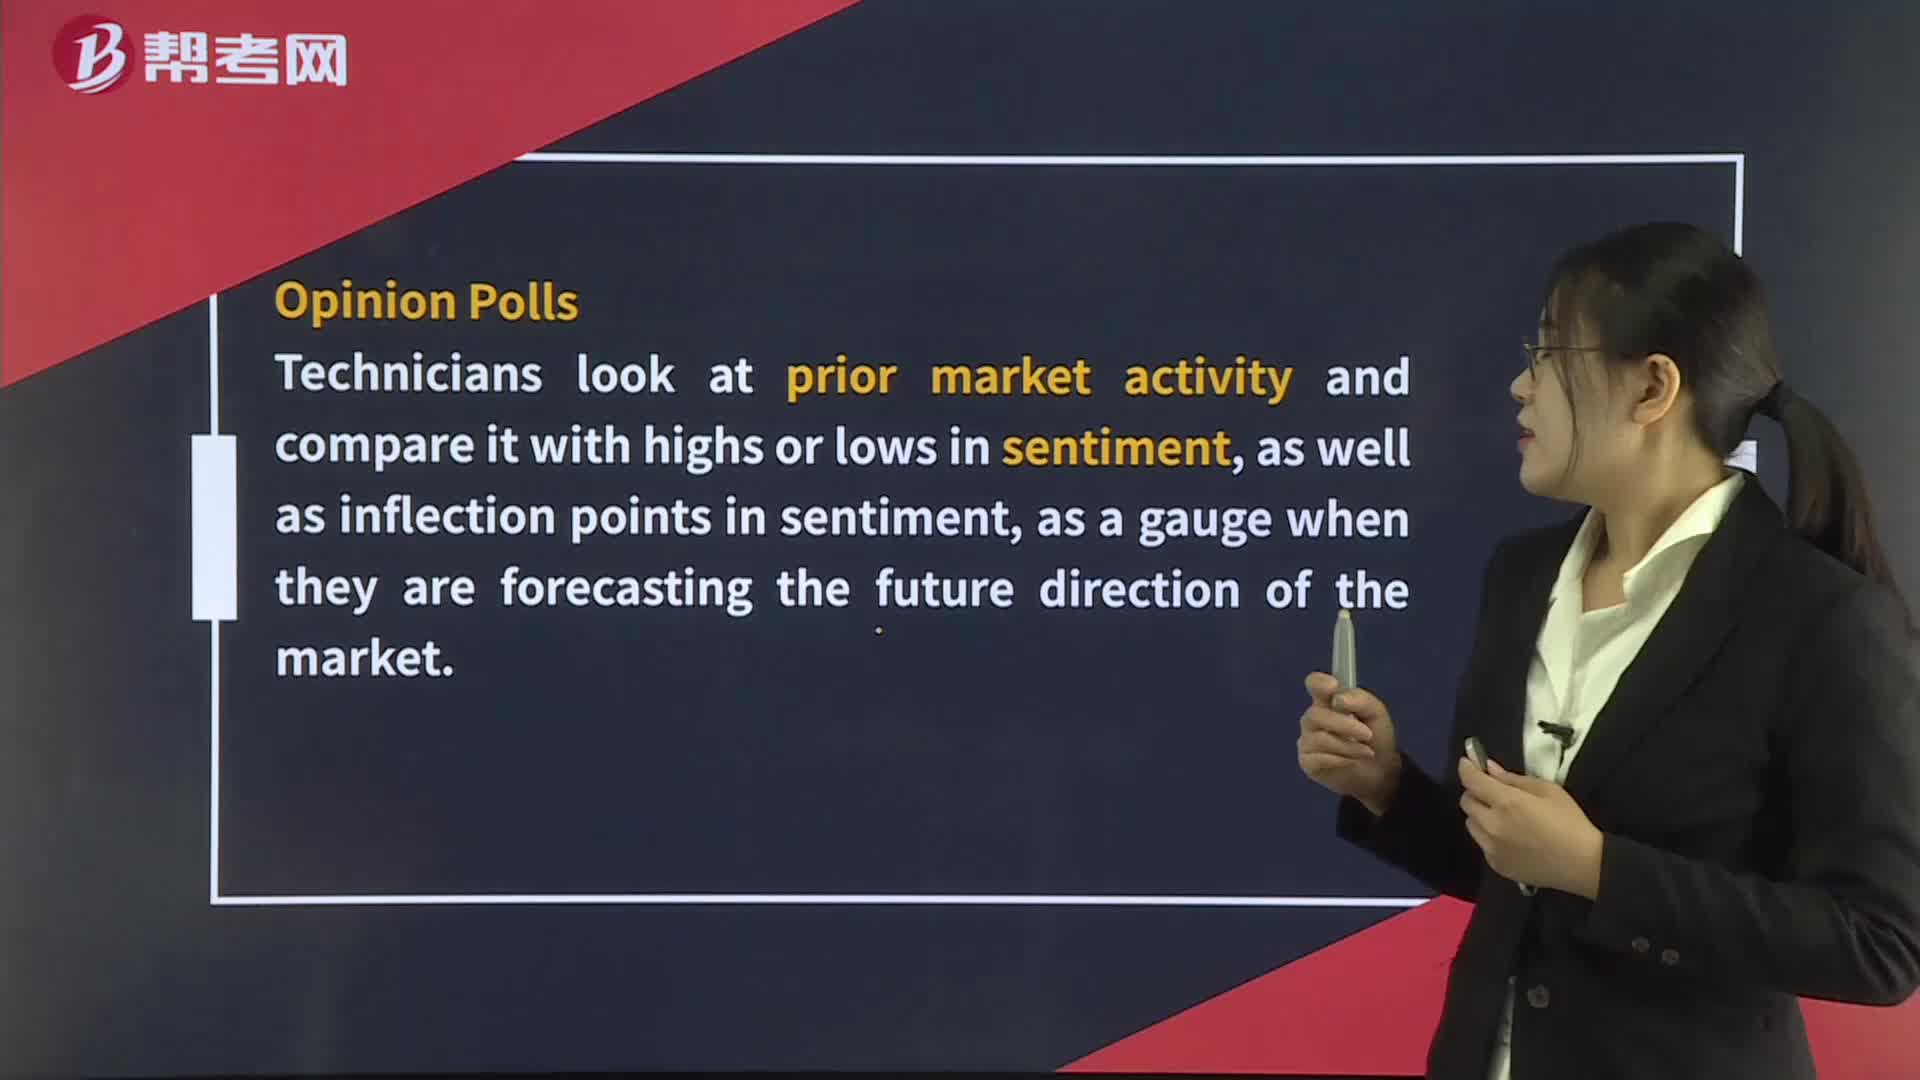
328Technical Indicators— Sentiment indicators:Exchange.debt.Shortinterest as an indicator.
 400
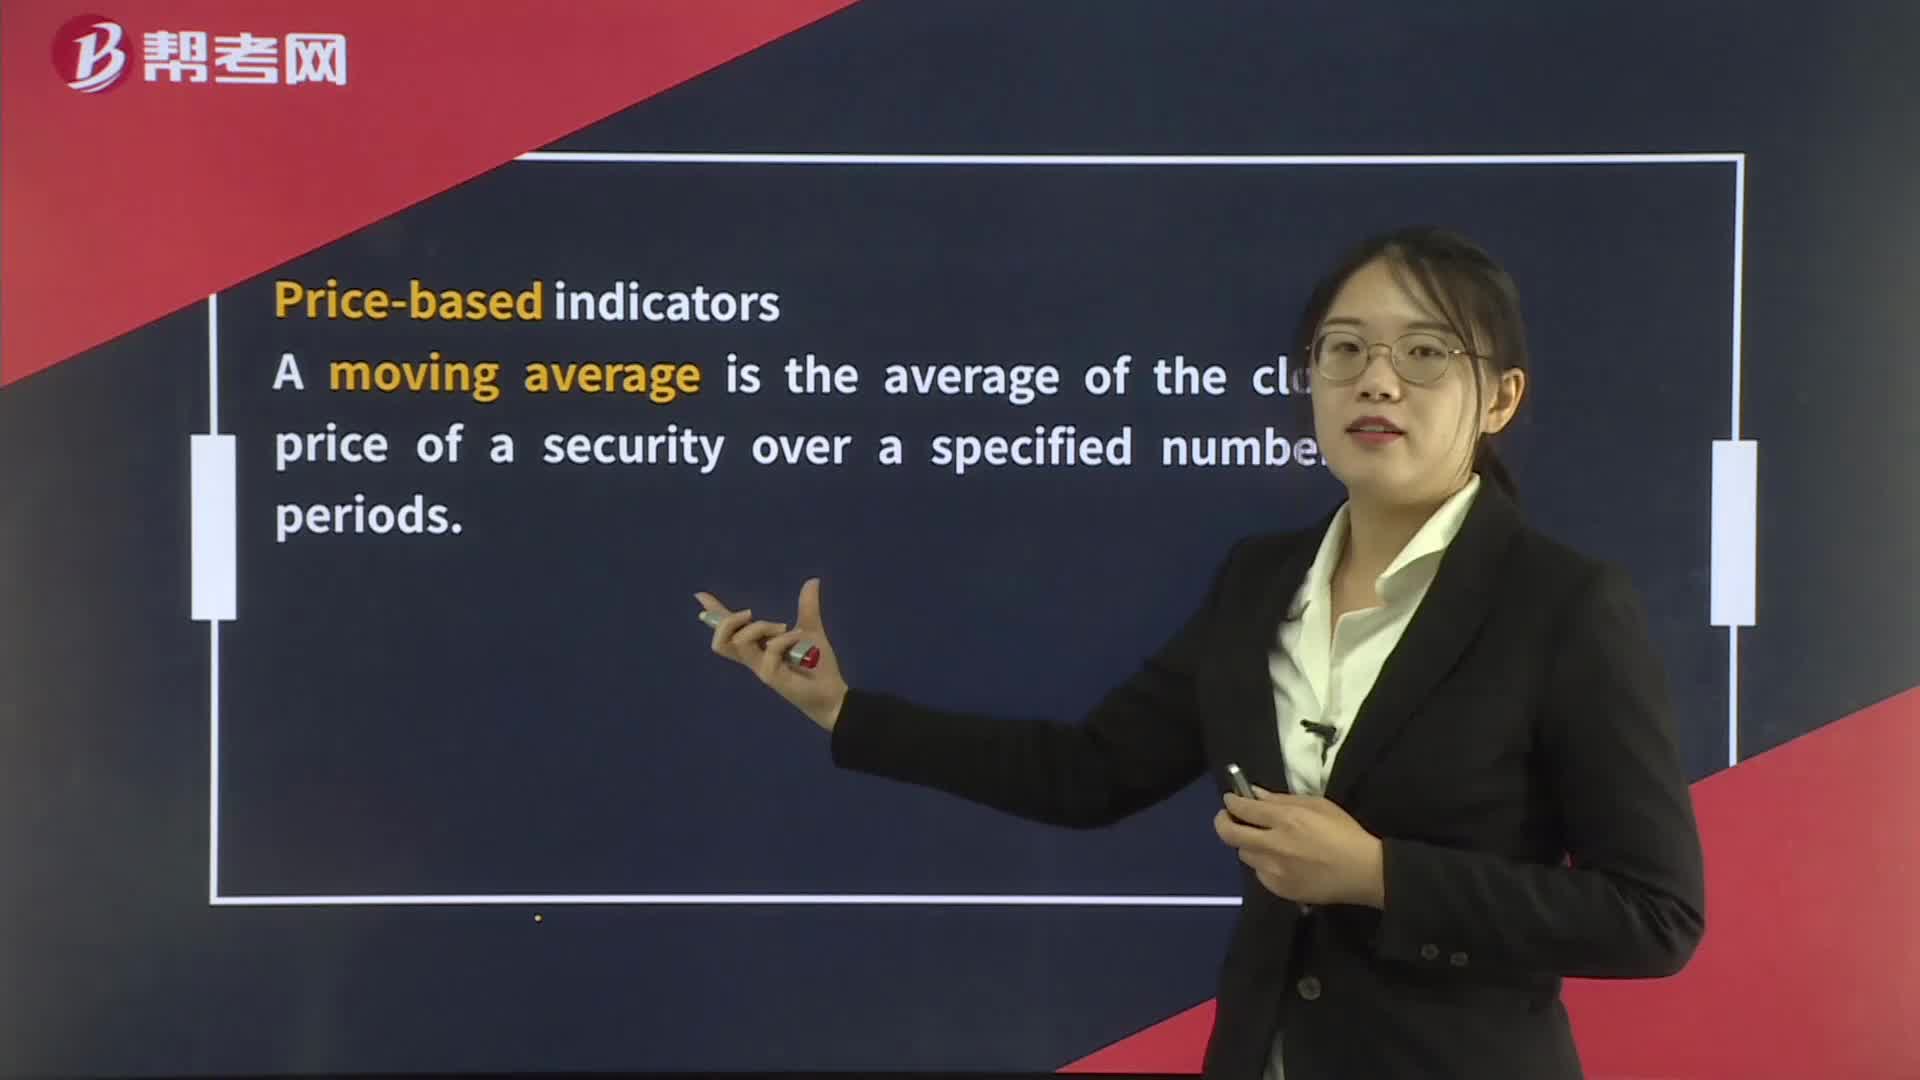
400Technical Indicators— Price-based Indicators:Simple moving average:moving-average linestrategyLong-term investors might buy on a significantthe lower band.

微信掃碼關(guān)注公眾號(hào)
獲取更多考試熱門資料