
下載億題庫(kù)APP
聯(lián)系電話:400-660-1360
下載億題庫(kù)APP
聯(lián)系電話:400-660-1360

請(qǐng)謹(jǐn)慎保管和記憶你的密碼,以免泄露和丟失
請(qǐng)謹(jǐn)慎保管和記憶你的密碼,以免泄露和丟失
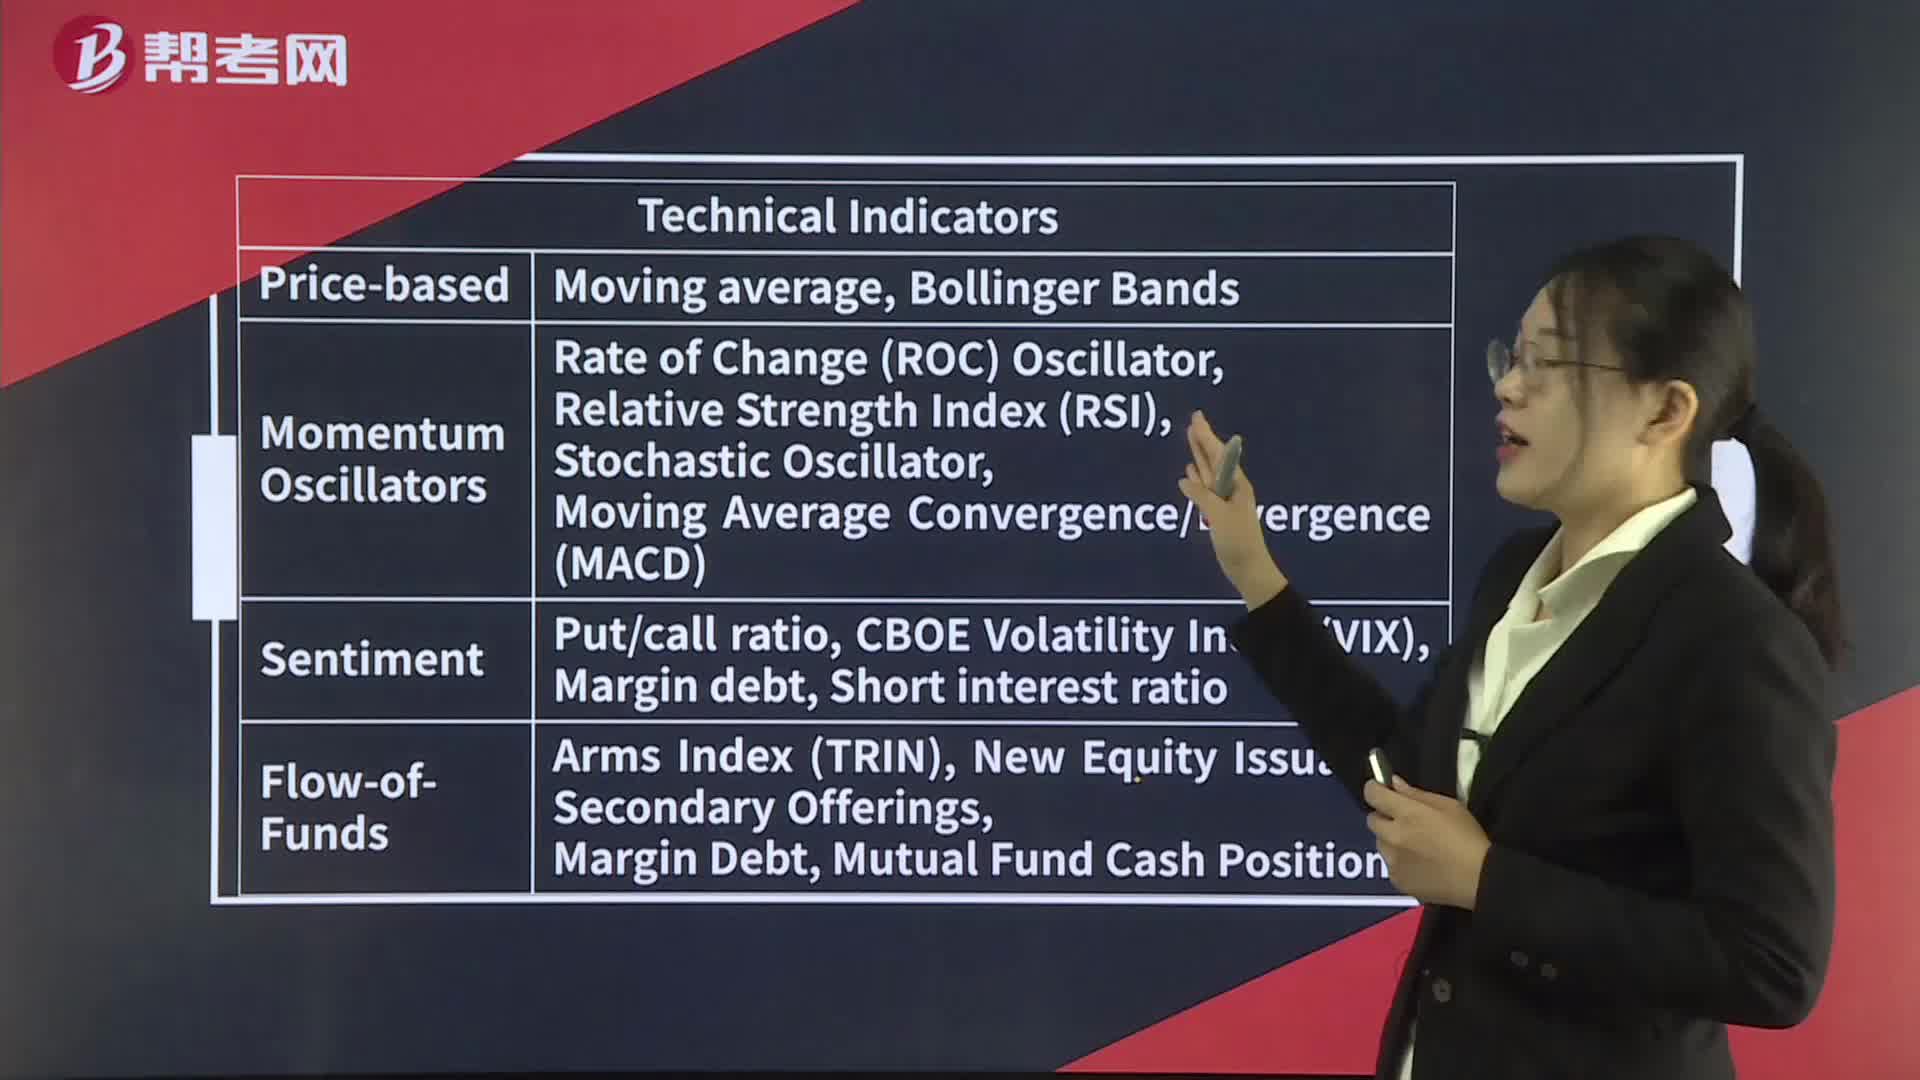
Technical Indicators— Flow-of-Funds Indicators
Flow-of-Funds Indicators
Technicians look at fund flows as a way to gauge the potential supply and demand for equities.
微信截圖_1596770099983520200807111516803.png)
Arms index near 1.0, the market is in balance.
A value above 1.0 means that there is more volume in declining stocks; a value below 1.0 means that most trading activity is in rising stocks.
Margin debt is also widely used as a flow-of-fundsindicator because margin loans may increase the purchases of stocks and declining margin balances may force the selling of stocks.
Mutual Fund Cash Position
Contrarian indicator.
The average year-end mutual fund cash in the US as a percentage of assets from 1984 through 2008 was 6.8 percent.
New Equity Issuance
The new equity issuance indicator suggests that as the number of initial public offerings (IPOs) increases, the upward price trend may be about to turn down.
Premium prices occur near market tops.
IPOs increase the aggregate supply of shares available for investors to purchase.
Secondary Offerings
From a market perspective, secondary offerings of shares have the potential to change the supply-and-demand equation as much as IPOs do.
 183
183Technical Indicators— Summary:Technical Indicators— Summary:C. a moving-average line with[Practiceconstructed so that they oscillate between a high and a low or around 0 or 100.
 328
328Technical Indicators— Sentiment indicators:Exchange.debt.Shortinterest as an indicator.
 400
400Technical Indicators— Price-based Indicators:Simple moving average:moving-average linestrategyLong-term investors might buy on a significantthe lower band.

微信掃碼關(guān)注公眾號(hào)
獲取更多考試熱門(mén)資料